Columbia: Fire Incidents, Connecticut (CT)
Where are fire incidents reported in Columbia, CT
Something went wrong! Please refresh the page.
|
| |||||||||||||||||||||||||||||||||||||||||||||||||||||||||||||||||||||||||||||||||||||||||||||||||||||||||||||
2002 - 2018 National Fire Incident Reporting System (NFIRS) incidents
- Incident types reported to NFIRS in Columbia, CT
- 1,82360.6%Rescue & EMS
- 37612.5%Hazardous Condition
- 30410.1%Fire
- 1936.4%False Alarm
- 1715.7%Service Call
- 1234.1%Good Intent Call
- 140.5%Severe Weather
- 40.1%Special Incident
- Fire incident types reported to NFIRS in Columbia, CT
- 18560.9%Structure Fires
- 4213.8%Outside Fires
- 4113.5%Other
- 3611.8%Mobile Property/Vehicle Fires
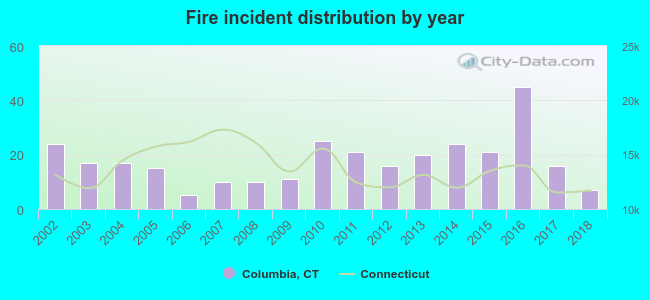 Based on the data from the years 2002 - 2018 the average number of fires per year is 18. The highest number of fires - 45 took place in 2016, and the least - 5 in 2006. The data has a decreasing trend.
The average number of yearly fire incidents per 10k residents in Columbia, CT compared to nearest cities:
(Note: Based on data for the last 3 years, including only cities with population 5,000 and above)
| Columbia: | 41.3 |
| Willimantic: | 41.5 |
| Windham: | 5.9 |
| Coventry: | 10.2 |
| Hebron: | 17.2 |
| Lebanon: | 32.8 |
| Mansfield: | 6.8 |
| Storrs: | 26.1 |
| Marlborough: | 23.9 |

 32.2% incidents where reported in the morning and 67.8% in the evening. The most fires (17.1%) took place on Friday, and the least (10.5%) on Wednesday.
 According to the 304 fire incidents from years 2002 - 2018 most fires (16.1%) took place during January, and the least (4.3%) in September.
 Out of all 3,010 cases reported during the years 2002 - 2018, the most belonged to the categories: Rescue & EMS (60.6%), Hazardous Condition (12.5%), and Fire (10.1%).
 When looking into fire subcategories, the most incidents belonged to: Structure Fires (60.9%), and Outside Fires (13.8%).