Storrs: Fire Incidents, Connecticut (CT)
Where are fire incidents reported in Storrs, CT
Something went wrong! Please refresh the page.
|
| |||||||||||||||||||||||||||||||||||||||||||||||||||||||||||||||||||||||||||||||||||||||||||||||||||||||||||||
2002 - 2018 National Fire Incident Reporting System (NFIRS) incidents
- Incident types reported to NFIRS in Storrs, CT
- 4,96845.5%False Alarm
- 3,49432.0%Rescue & EMS
- 1,10310.1%Hazardous Condition
- 5104.7%Good Intent Call
- 4163.8%Fire
- 3743.4%Service Call
- 440.4%Overpressure Rupture
- 180.2%Special Incident
- Fire incident types reported to NFIRS in Storrs, CT
- 20649.5%Structure Fires
- 16639.9%Outside Fires
- 286.7%Mobile Property/Vehicle Fires
- 163.8%Other
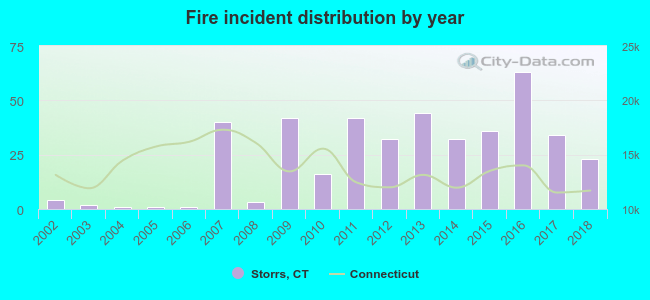 Based on the data from the years 2002 - 2018 the average number of fires per year is 24. The highest number of reported fires - 63 took place in 2016, and the least - 1 in 2004. The data has an increasing trend.
The average number of yearly fire incidents per 10k residents in Storrs, CT compared to nearest cities:
(Note: Based on data for the last 3 years, including only cities with population 5,000 and above)
| Storrs: | 26.1 |
| Mansfield: | 6.8 |
| Coventry: | 10.2 |
| Willington: | 14.3 |
| Willimantic: | 41.5 |
| Windham: | 5.9 |
| Columbia: | 41.3 |
| Tolland: | 20.2 |
| Vernon: | 18.4 |

 According to the reports from the years 2002 - 2018 the average number of fire-related casualties per year is 0. The highest number of casualties - 4 took place in 2012, and the lowest - 0 in 2002. The data has a constant trend.
 31.7% incidents where reported in the morning and 68.3% in the evening. The most fires (16.6%) took place on Tuesday, and the least (9.9%) on Saturday.
 Based on the 416 incident reports from years 2002 - 2018 most fires (15.6%) took place during April, and the least (2.4%) in July.
 Out of all 10,927 cases reported during the years 2002 - 2018, the most belonged to the categories: False Alarm (45.5%), Rescue & EMS (32.0%), and Hazardous Condition (10.1%).
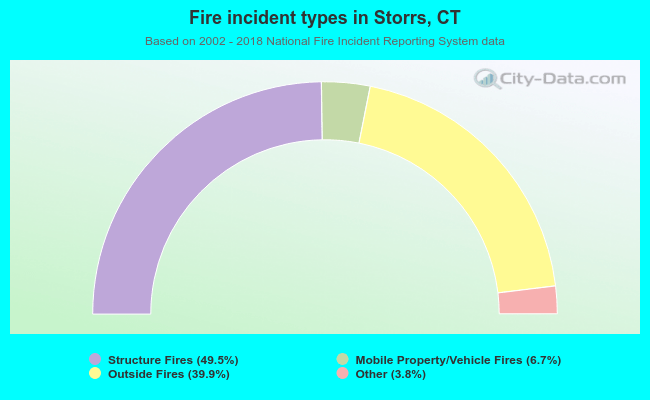 When looking into fire subcategories, the most incidents belonged to: Structure Fires (49.5%), and Outside Fires (39.9%).