Conover: Fire Incidents, North Carolina (NC)
Where are fire incidents reported in Conover, NC
Something went wrong! Please refresh the page.
|
| |||||||||||||||||||||||||||||||||||||||||||||||||||||||||||||||||||||||||||||||||||||||||||||||||||||||||||||
| Other | 48 | |||||||||||||||||||||||||||||||||||||||||||||||||||||||||||||||||||||||||||||||||||||||||||||||||||||||||||||
2002 - 2018 National Fire Incident Reporting System (NFIRS) incidents
- Incident types reported to NFIRS in Conover, NC
- 3,11434.6%Rescue & EMS
- 1,59517.7%Service Call
- 1,44416.0%Hazardous Condition
- 1,30514.5%False Alarm
- 1,05611.7%Fire
- 4374.9%Good Intent Call
- 370.4%Severe Weather
- Fire incident types reported to NFIRS in Conover, NC
- 39036.9%Structure Fires
- 37035.0%Outside Fires
- 21320.2%Mobile Property/Vehicle Fires
- 837.9%Other
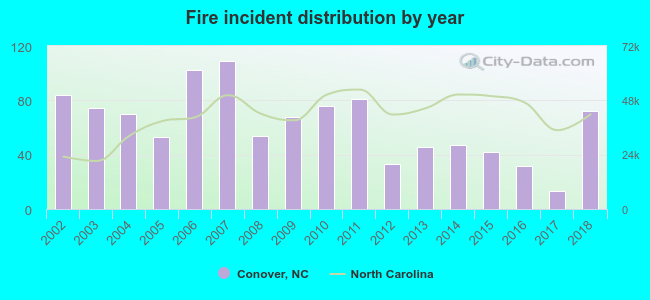 According to the data from the years 2002 - 2018 the average number of fires per year is 62. The highest number of reported fires - 109 took place in 2007, and the least - 13 in 2017. The data has a declining trend.
The average number of yearly fire incidents per 10k residents in Conover, NC compared to nearest cities:
(Note: Based on data for the last 3 years, including only cities with population 5,000 and above)
| Conover: | 47.5 |
| Newton: | 24.1 |
| Hickory: | 72.1 |
| Lincolnton: | 216.8 |
| Statesville: | 105.5 |
| Lenoir: | 95.8 |
| Mooresville: | 71.8 |
| Cherryville: | 89.2 |
| Cornelius: | 14.8 |
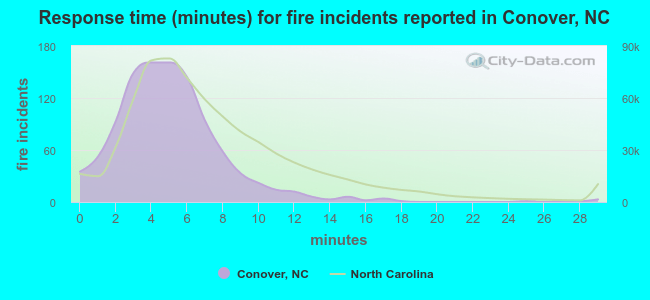 The median response time based on all reported fire incidents is 5 minutes. This is lower compared to the North Carolina median value.
The median response time in Conover, NC compared to nearest cities:
(Note: Based on data for all years, including only cities with at least 500 fire incidents)
| Conover: | 5 minutes |
| Newton: | 5 minutes |
| Claremont: | 5 minutes |
| Hickory: | 5 minutes |
| Catawba: | 6 minutes |
| Maiden: | 6 minutes |
| Granite Falls: | 4 minutes |
| Taylorsville: | 6 minutes |
| Sherrills Ford: | 5 minutes |
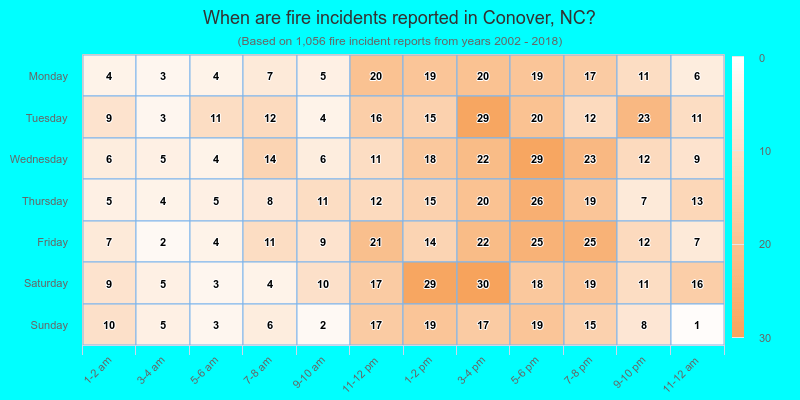
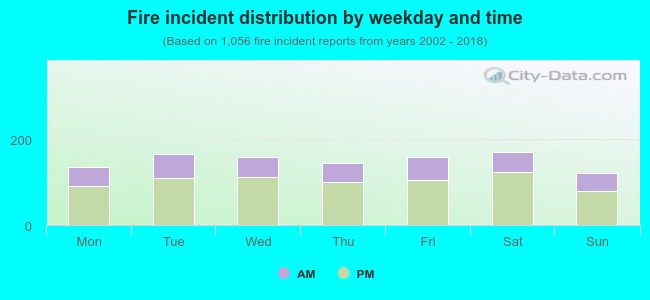 31.6% incidents where reported in the morning and 68.4% in the evening. The most fires (16.2%) took place on Saturday, and the least (11.6%) on Sunday.
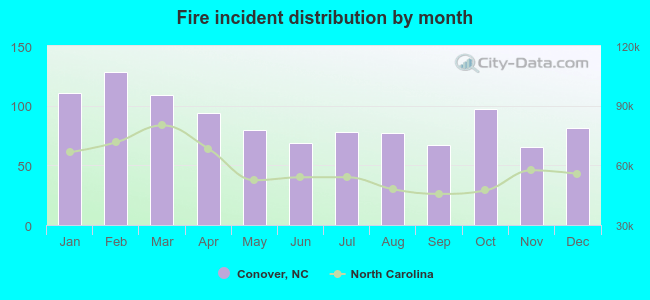 According to the 1,056 reports from years 2002 - 2018 most fires (12.1%) took place during February, and the least (6.2%) in November.
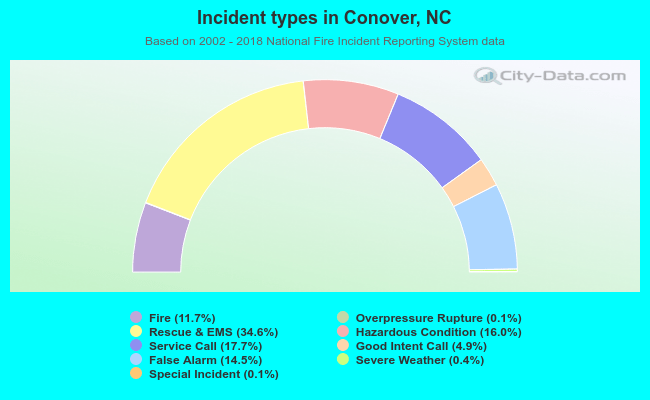 Out of all 8,998 cases reported during the years 2002 - 2018, the most belonged to the categories: Rescue & EMS (34.6%), Service Call (17.7%), and Hazardous Condition (16.0%).
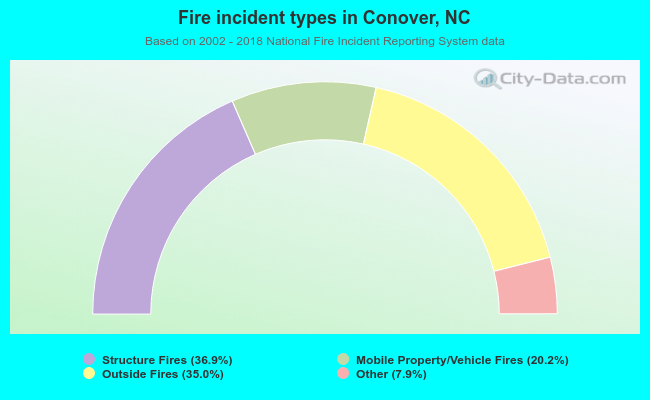 When looking into fire subcategories, the most reports belonged to: Structure Fires (36.9%), and Outside Fires (35.0%).