Lenoir: Fire Incidents, North Carolina (NC)
Where are fire incidents reported in Lenoir, NC
Something went wrong! Please refresh the page.
| Fire incidents reported | |
|---|---|
| Sreet name | Count |
| MORGANTON BLVD | 242 |
| BLOWING ROCK BLVD | 184 |
| NORWOOD ST | 104 |
| CONNELLY SPRINGS RD | 90 |
| HARPER AVE | 90 |
| WILKESBORO BLVD | 84 |
| HICKORY BLVD | 82 |
| ABINGTON RD | 80 |
| CHERAW RD | 70 |
| CALICO RD | 56 |
| COLLETTSVILLE RD | 56 |
| OLD NORTH RD | 50 |
| CLARKS CHAPEL RD | 48 |
| PLAYMORE BEACH RD | 48 |
| ROCKY RD | 44 |
| VIRGINIA ST | 42 |
| MAIN ST | 40 |
| CELIA CREEK RD | 36 |
| GRANDIN RD | 36 |
| UNION GROVE RD | 36 |
| NORTH FAIRVIEW DR | 34 |
| BEE MOUNTAIN RIDGE RD | 32 |
| LOWER CREEK DR | 32 |
| COMPLEX PL | 30 |
| NUWAY CIR | 30 |
| TAYLORSVILLE RD | 30 |
| VALWAY RD | 30 |
| WALT ARNEY RD | 30 |
| DEERBROOK RD | 28 |
| HARTLAND RD | 28 |
| Other | 1,227 |
2002 - 2018 National Fire Incident Reporting System (NFIRS) incidents
- Incident types reported to NFIRS in Lenoir, NC
- 14,02554.9%Rescue & EMS
- 3,04911.9%Fire
- 3,02911.9%Service Call
- 2,3159.1%Hazardous Condition
- 1,5055.9%Good Intent Call
- 1,4635.7%False Alarm
- 1170.5%Severe Weather
- Fire incident types reported to NFIRS in Lenoir, NC
- 1,36044.6%Structure Fires
- 1,11736.6%Outside Fires
- 43714.3%Mobile Property/Vehicle Fires
- 1354.4%Other
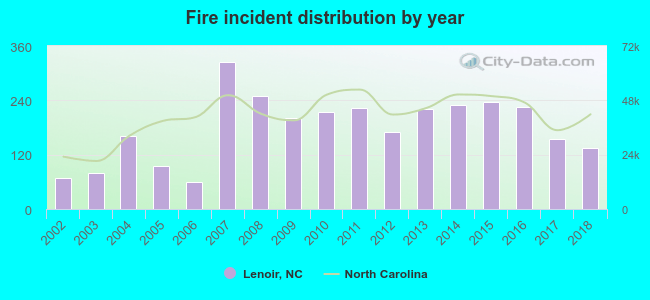 According to the data from the years 2002 - 2018 the average number of fire incidents per year is 179. The highest number of reported fire incidents - 325 took place in 2007, and the least - 59 in 2006. The data has an increasing trend.
The average number of yearly fire incidents per 10k residents in Lenoir, NC compared to nearest cities:
(Note: Based on data for the last 3 years, including only cities with population 5,000 and above)
| Lenoir: | 95.8 |
| Morganton: | 134.4 |
| Hickory: | 72.1 |
| Conover: | 47.5 |
| Boone: | 43.9 |
| Newton: | 24.1 |
| Marion: | 300.1 |
| Lincolnton: | 216.8 |
| Cherryville: | 89.2 |
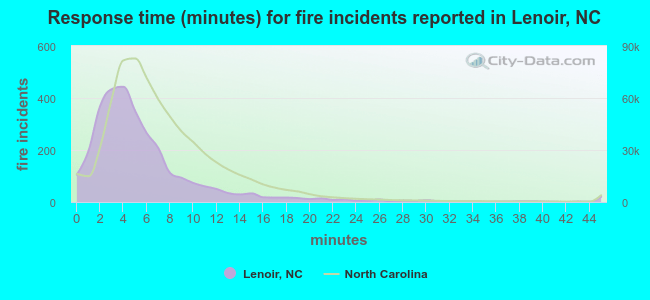 The median response time based on all reported fire incidents is 4 minutes. This is lower compared to the state median value.
The median response time in Lenoir, NC compared to nearest cities:
(Note: Based on data for all years, including only cities with at least 500 fire incidents)
| Lenoir: | 4 minutes |
| Hudson: | 4 minutes |
| Granite Falls: | 4 minutes |
| Connelly Springs: | 8 minutes |
| Valdese: | 6 minutes |
| Morganton: | 7 minutes |
| Hickory: | 5 minutes |
| Taylorsville: | 6 minutes |
| Conover: | 5 minutes |
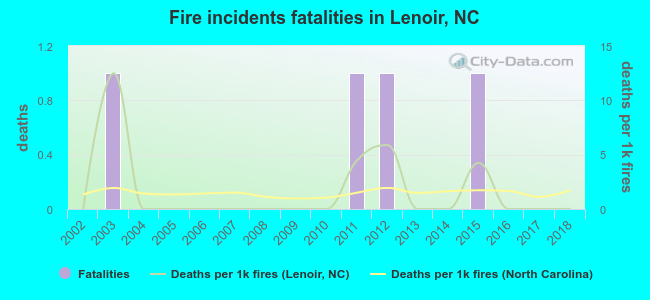 Based on the data from the years 2002 - 2018 the average number of fire-related fatalities per year is 0. The highest number of deaths - 1 took place in 2003, and the lowest - 0 in 2002. The data has a constant trend.
The average number of fatalities per 1,000 fires is 2. This indicator was the highest - 13 in 2003, and the lowest 0 in 2002. The trend for deaths per 1,000 fires is constant. Compared to the state value the number of fatalities per 1,000 fires is similar.
Based on the data from the years 2002 - 2018 the average number of fire-related fatalities per year is 0. The highest number of deaths - 1 took place in 2003, and the lowest - 0 in 2002. The data has a constant trend.
The average number of fatalities per 1,000 fires is 2. This indicator was the highest - 13 in 2003, and the lowest 0 in 2002. The trend for deaths per 1,000 fires is constant. Compared to the state value the number of fatalities per 1,000 fires is similar.Deaths per 1,000 incidents in Lenoir, NC compared to nearest cities:
(Note: Based on data for all years, including only cities with at least 2,500 fire incidents)
| Lenoir: | 1.3 |
| Morganton: | 3.0 |
| Hickory: | 0.8 |
| Marion: | 1.4 |
| Lincolnton: | 2.4 |
| Statesville: | 0.8 |
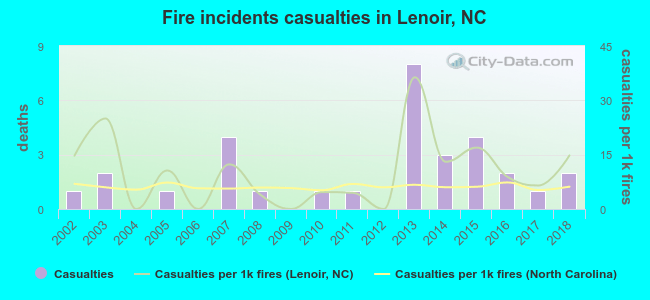 Based on the data from the years 2002 - 2018 the average number of fire-related yearly casualties is 2. The highest number of reported casualties - 8 took place in 2013, and the lowest - 0 in 2004. The data has an increasing trend.
The average number of casualties per 1,000 fire incidents is 10. This indicator was the highest - 36 in 2013, and the lowest 0 in 2004. The trend for injuries per 1,000 fires is increasing. Compared to the state value the number of injuries per 1,000 fires is higher.
Based on the data from the years 2002 - 2018 the average number of fire-related yearly casualties is 2. The highest number of reported casualties - 8 took place in 2013, and the lowest - 0 in 2004. The data has an increasing trend.
The average number of casualties per 1,000 fire incidents is 10. This indicator was the highest - 36 in 2013, and the lowest 0 in 2004. The trend for injuries per 1,000 fires is increasing. Compared to the state value the number of injuries per 1,000 fires is higher.Casualties per 1,000 incidents in Lenoir, NC compared to nearest cities:
(Note: Based on data for all years, including only cities with at least 500 fire incidents)
| Lenoir: | 10.2 |
| Hudson: | 3.5 |
| Granite Falls: | 2.1 |
| Connelly Springs: | 4.8 |
| Valdese: | 11.2 |
| Morganton: | 6.9 |
| Hickory: | 9.7 |
| Taylorsville: | 1.6 |
| Conover: | 0.0 |
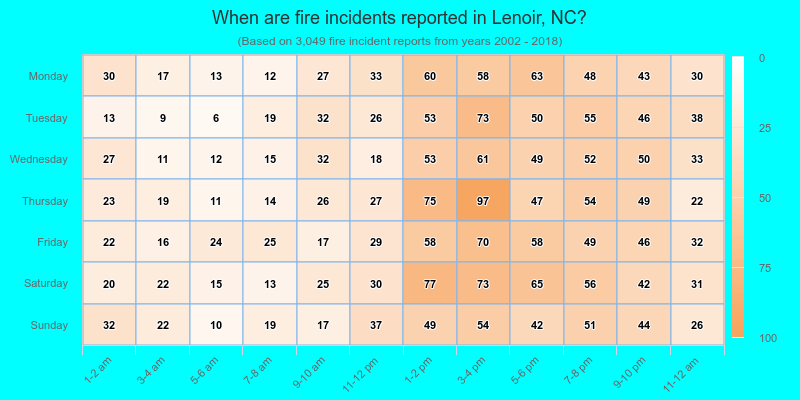
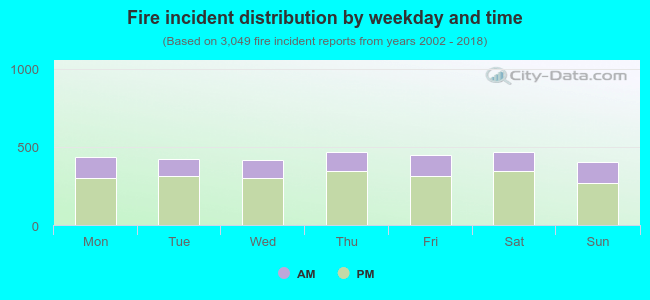 28.4% incidents where reported in the morning and 71.6% in the evening. The most fires (15.4%) took place on Saturday, and the least (13.2%) on Sunday.
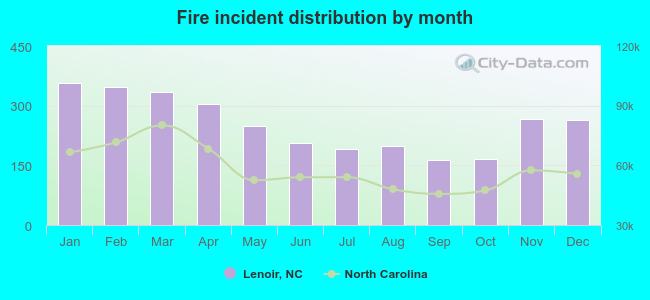 Based on the 3,049 fires from years 2002 - 2018 most fires (11.7%) took place during January, and the least (5.3%) in September.
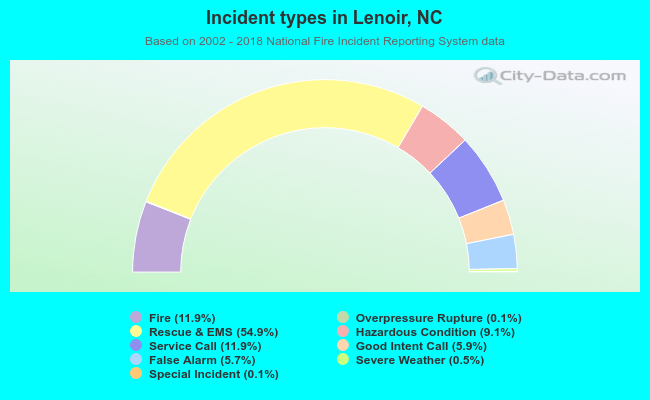 Out of all 25,543 cases reported during the years 2002 - 2018, the most belonged to the categories: Rescue & EMS (54.9%), Fire (11.9%), and Service Call (11.9%).
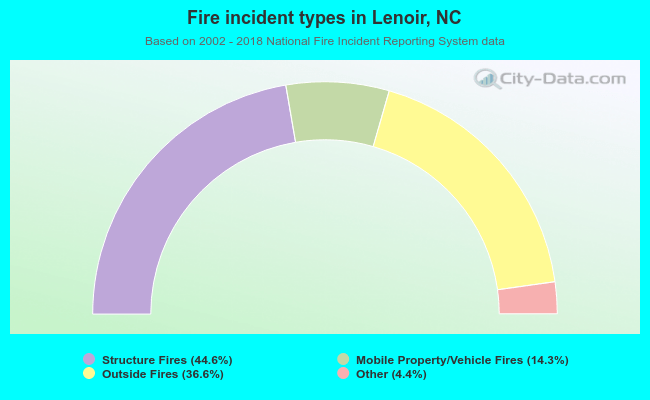 When looking into fire subcategories, the most incidents belonged to: Structure Fires (44.6%), and Outside Fires (36.6%).