Conyers: Fire Incidents, Georgia (GA)
Where are fire incidents reported in Conyers, GA
Something went wrong! Please refresh the page.
| Fire incidents reported | |
|---|---|
| Sreet name | Count |
| MAIN ST | 110 |
| GEORGIA 138 8-304 HWY | 106 |
| FRONTIER DR | 86 |
| OGLESBY BRIDGE RD | 80 |
| INTERSTATE 20 8-304 EXPY | 76 |
| OLD COVINGTON HWY | 74 |
| DOGWOOD 8-304 DR | 62 |
| SMYRNA RD | 62 |
| GEORGIA 138 1-305 HWY | 58 |
| LAKESHORE DR | 58 |
| LAKE ROCKAWAY RD | 56 |
| BRANDON GLEN WAY | 54 |
| HIGHTOWER TRL | 54 |
| PARKER RD | 54 |
| HONEY CREEK RD | 52 |
| KESWICK VILLAGE CT | 48 |
| PINE LOG RD | 48 |
| GREEN ST | 46 |
| PEAKS LNDG | 46 |
| GA HWY 138 | 44 |
| GA HWY 20 | 44 |
| GEES MILL RD | 44 |
| HI ROC RD | 44 |
| MAGNOLIA DR | 44 |
| SALEM RD | 44 |
| WEST AVE | 44 |
| HARVEST GROVE LA | 42 |
| LOCH HAVEN DR | 42 |
| MILLCREST WALK | 42 |
| SALEM 3-307 RD | 42 |
| Other | 3,835 |
2003 - 2018 National Fire Incident Reporting System (NFIRS) incidents
- Incident types reported to NFIRS in Conyers, GA
- 18,54944.6%Rescue & EMS
- 7,16917.2%Good Intent Call
- 5,54113.3%Fire
- 3,8599.3%Service Call
- 3,8429.2%Hazardous Condition
- 2,4555.9%False Alarm
- 830.2%Special Incident
- 700.2%Severe Weather
- 620.1%Overpressure Rupture
- Fire incident types reported to NFIRS in Conyers, GA
- 2,50045.1%Outside Fires
- 1,67830.3%Structure Fires
- 1,18621.4%Mobile Property/Vehicle Fires
- 1773.2%Other
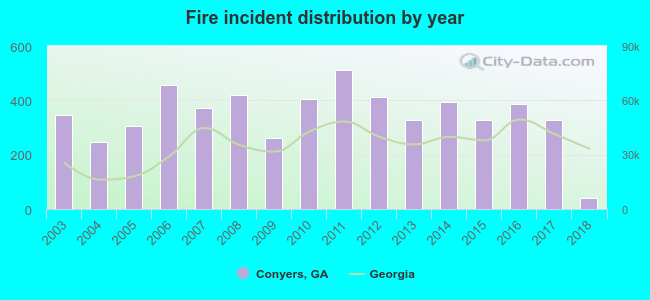 According to the data from the years 2003 - 2018 the average number of fire incidents per year is 346. The highest number of fires - 510 took place in 2011, and the least - 40 in 2018. The data has a decreasing trend.
The average number of yearly fire incidents per 10k residents in Conyers, GA compared to nearest cities:
(Note: Based on data for the last 3 years, including only cities with population 5,000 and above)
| Conyers: | 159.9 |
| Covington: | 246.6 |
| Snellville: | 80.4 |
| Stone Mountain: | 481.3 |
| Loganville: | 153.9 |
| Stockbridge: | 65.5 |
| Clarkston: | 56.1 |
| Scottdale: | 11.0 |
| Lilburn: | 85.8 |
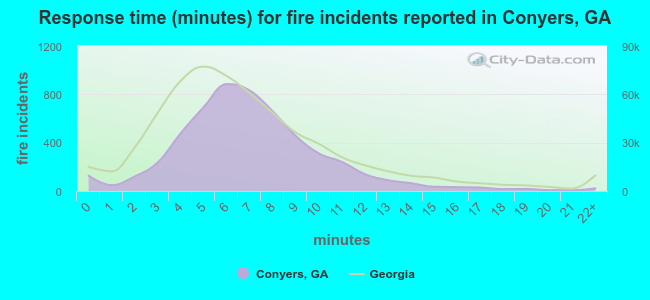 The median response time based on all reported fire incidents is 7 minutes. This is close to the Georgia median value.
The median response time in Conyers, GA compared to nearest cities:
(Note: Based on data for all years, including only cities with at least 500 fire incidents)
| Conyers: | 7 minutes |
| Lithonia: | 7 minutes |
| Oxford: | 9 minutes |
| Covington: | 7 minutes |
| Snellville: | 8 minutes |
| Stone Mountain: | 6 minutes |
| Loganville: | 7 minutes |
| Stockbridge: | 7 minutes |
| Clarkston: | 6 minutes |
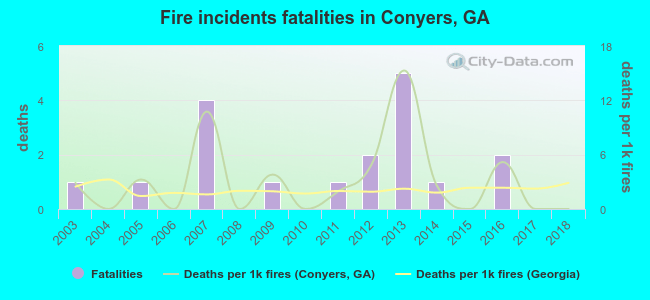 According to the reports from the years 2003 - 2018 the average number of fire-related yearly deaths is 1. The highest number of deaths - 5 took place in 2013, and the lowest - 0 in 2004. The data has a dropping trend.
The average number of deaths per 1,000 fires is 3. This indicator was the highest - 15 in 2013, and the lowest 0 in 2004. The trend for deaths per 1,000 fires is dropping. Compared to the Georgia value the number of fatalities per 1,000 fires is higher.
According to the reports from the years 2003 - 2018 the average number of fire-related yearly deaths is 1. The highest number of deaths - 5 took place in 2013, and the lowest - 0 in 2004. The data has a dropping trend.
The average number of deaths per 1,000 fires is 3. This indicator was the highest - 15 in 2013, and the lowest 0 in 2004. The trend for deaths per 1,000 fires is dropping. Compared to the Georgia value the number of fatalities per 1,000 fires is higher.Deaths per 1,000 incidents in Conyers, GA compared to nearest cities:
(Note: Based on data for all years, including only cities with at least 2,500 fire incidents)
| Conyers: | 3.2 |
| Lithonia: | 1.6 |
| Covington: | 0.8 |
| Stone Mountain: | 2.3 |
| Loganville: | 1.2 |
| Stockbridge: | 2.3 |
| McDonough: | 0.7 |
| Decatur: | 2.1 |
| Monroe: | 2.0 |
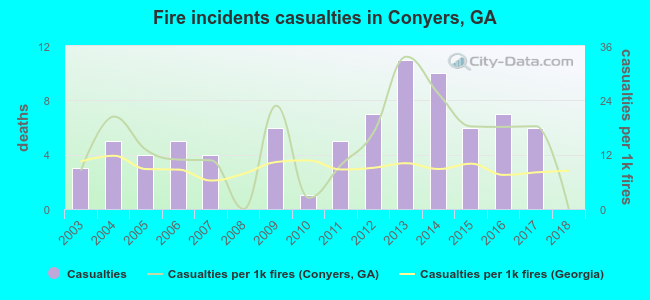 Based on the reports from the years 2003 - 2018 the average number of fire-related casualties per year is 5. The highest number of reported injuries - 11 took place in 2013, and the lowest - 0 in 2008. The data has a declining trend.
The average number of injuries per 1,000 fires is 14. This indicator was the highest - 34 in 2013, and the lowest 0 in 2008. The trend for injuries per 1,000 fires is dropping. Compared to the Georgia value the number of injuries per 1,000 incidents is higher.
Based on the reports from the years 2003 - 2018 the average number of fire-related casualties per year is 5. The highest number of reported injuries - 11 took place in 2013, and the lowest - 0 in 2008. The data has a declining trend.
The average number of injuries per 1,000 fires is 14. This indicator was the highest - 34 in 2013, and the lowest 0 in 2008. The trend for injuries per 1,000 fires is dropping. Compared to the Georgia value the number of injuries per 1,000 incidents is higher.Casualties per 1,000 incidents in Conyers, GA compared to nearest cities:
(Note: Based on data for all years, including only cities with at least 500 fire incidents)
| Conyers: | 14.4 |
| Lithonia: | 5.9 |
| Oxford: | 2.0 |
| Covington: | 8.7 |
| Snellville: | 22.7 |
| Stone Mountain: | 6.5 |
| Loganville: | 10.4 |
| Stockbridge: | 11.6 |
| Clarkston: | 4.1 |
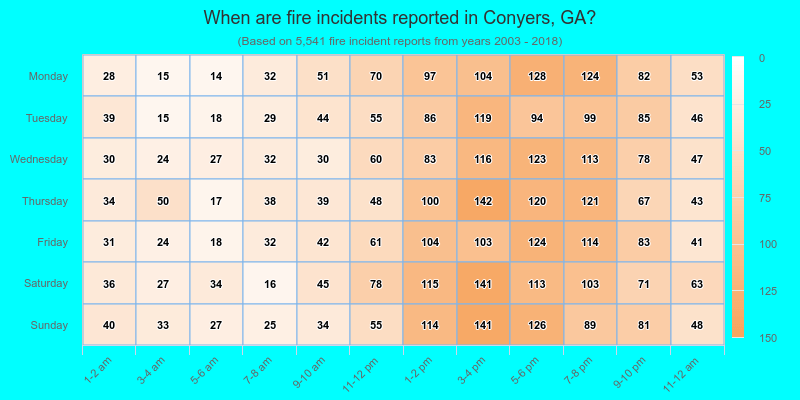
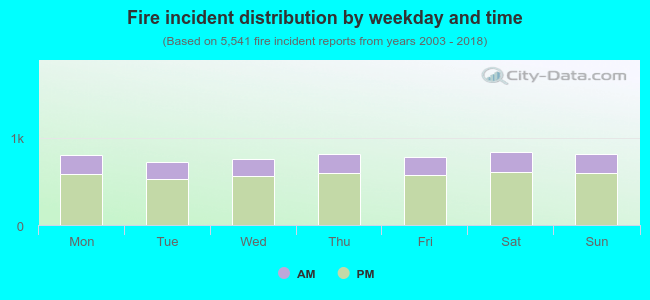 27.0% incidents where reported in the morning and 73.0% in the evening. The most fires (15.2%) took place on Saturday, and the least (13.2%) on Tuesday.
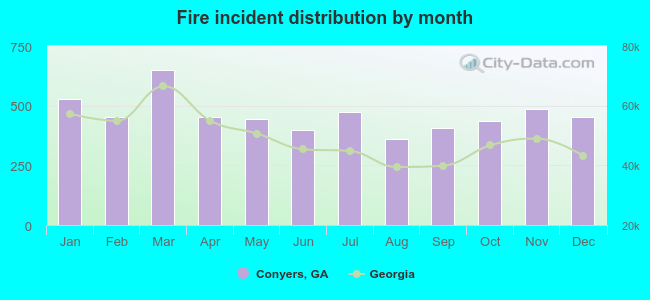 Based on the 5,541 incident reports from years 2003 - 2018 most fires (11.7%) took place during March, and the least (6.5%) in August.
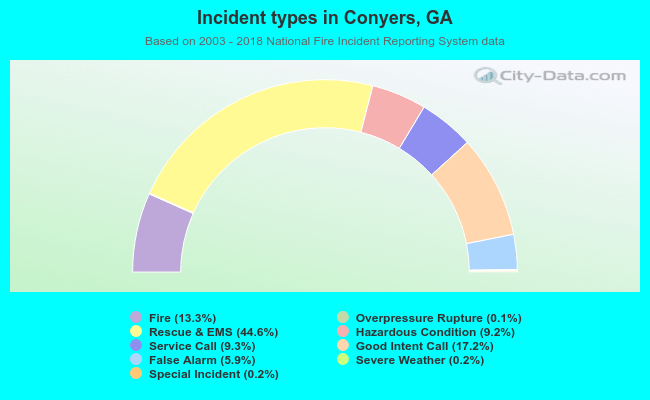 Out of all 41,630 cases reported during the years 2003 - 2018, the most belonged to the categories: Rescue & EMS (44.6%), Good Intent Call (17.2%), and Fire (13.3%).
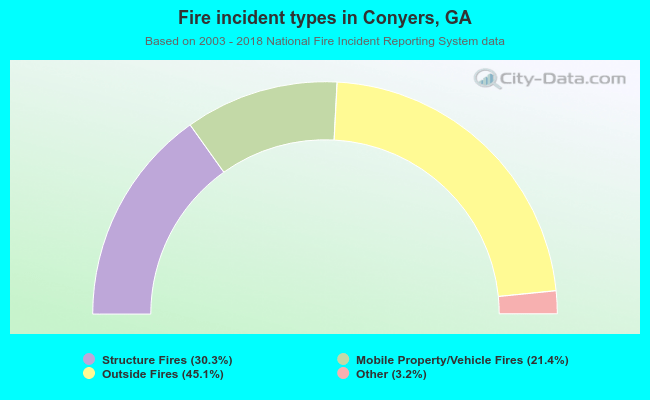 When looking into fire subcategories, the most incidents belonged to: Outside Fires (45.1%), and Structure Fires (30.3%).