McDonough: Fire Incidents, Georgia (GA)
Where are fire incidents reported in McDonough, GA
Something went wrong! Please refresh the page.
| Fire incidents reported | |
|---|---|
| Sreet name | Count |
| JONESBORO RD | 290 |
| I75 | 282 |
| INTERSTATE 75 | 150 |
| WILLOW LN | 134 |
| HIGHWAY 81 | 116 |
| AIRLINE RD | 100 |
| HIGHWAY 155 | 98 |
| 81 HWY | 96 |
| 20 HWY | 82 |
| EAST LAKE RD | 80 |
| KEYS FERRY RD | 78 |
| SNAPPING SHOALS RD | 78 |
| 155 HWY | 72 |
| HIGHWAY 20 | 72 |
| OLA RD | 70 |
| CRUMBLEY RD | 66 |
| HWY 81 | 64 |
| HWY 20 | 62 |
| JODECO RD | 62 |
| KING MILL RD | 60 |
| MCGARITY RD | 60 |
| BRIDGES RD | 58 |
| WALDEN RUN PL | 58 |
| 75 INT | 56 |
| PRESTON CREEK DR | 56 |
| SADDLE CREEK DR | 54 |
| CORAL CIR | 52 |
| WOODLAWN PARK DR | 52 |
| AMBER CHASE DR | 50 |
| MACON ST | 50 |
| Other | 2,744 |
2002 - 2018 National Fire Incident Reporting System (NFIRS) incidents
- Incident types reported to NFIRS in McDonough, GA
- 34,63764.8%Rescue & EMS
- 5,40210.1%Fire
- 3,7527.0%Good Intent Call
- 3,7197.0%Service Call
- 3,0545.7%Hazardous Condition
- 2,7355.1%False Alarm
- 680.1%Special Incident
- 600.1%Severe Weather
- Fire incident types reported to NFIRS in McDonough, GA
- 2,60648.2%Outside Fires
- 1,79433.2%Structure Fires
- 90216.7%Mobile Property/Vehicle Fires
- 1001.9%Other
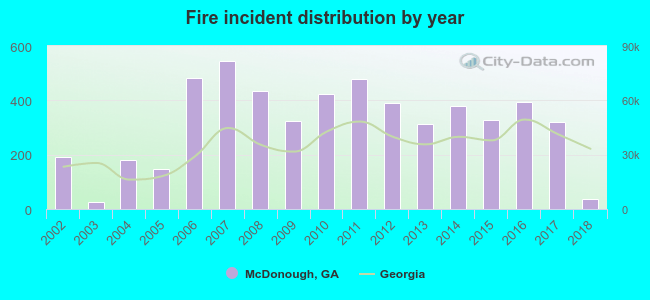 Based on the data from the years 2002 - 2018 the average number of fires per year is 318. The highest number of reported fire incidents - 543 took place in 2007, and the least - 25 in 2003. The data has a dropping trend.
The average number of yearly fire incidents per 10k residents in McDonough, GA compared to nearest cities:
(Note: Based on data for the last 3 years, including only cities with population 5,000 and above)
| McDonough: | 109.3 |
| Locust Grove: | 116.9 |
| Stockbridge: | 65.5 |
| Hampton: | 159.3 |
| Morrow: | 142.3 |
| Griffin: | 128.7 |
| Riverdale: | 147.4 |
| Conyers: | 159.9 |
| Forest Park: | 76.9 |
 The median response time based on all reported fire incidents is 7 minutes. This is about the same as the Georgia median value.
The median response time in McDonough, GA compared to nearest cities:
(Note: Based on data for all years, including only cities with at least 500 fire incidents)
| McDonough: | 7 minutes |
| Locust Grove: | 8 minutes |
| Stockbridge: | 7 minutes |
| Hampton: | 8 minutes |
| Jonesboro: | 6 minutes |
| Morrow: | 5 minutes |
| Jackson: | 6 minutes |
| Griffin: | 5 minutes |
| Riverdale: | 5 minutes |
 Based on the data from the years 2002 - 2018 the average number of fire-related yearly deaths is 0. The highest number of deaths - 1 took place in 2003, and the lowest - 0 in 2002. The data has a constant trend.
The average number of deaths per 1,000 fire incidents is 3. This indicator was the highest - 40 in 2003, and the lowest 0 in 2002. The trend for deaths per 1,000 fires is constant. Compared to the state value the number of fatalities per 1,000 fire incidents is much lower.
Based on the data from the years 2002 - 2018 the average number of fire-related yearly deaths is 0. The highest number of deaths - 1 took place in 2003, and the lowest - 0 in 2002. The data has a constant trend.
The average number of deaths per 1,000 fire incidents is 3. This indicator was the highest - 40 in 2003, and the lowest 0 in 2002. The trend for deaths per 1,000 fires is constant. Compared to the state value the number of fatalities per 1,000 fire incidents is much lower.Deaths per 1,000 incidents in McDonough, GA compared to nearest cities:
(Note: Based on data for all years, including only cities with at least 2,500 fire incidents)
| McDonough: | 0.7 |
| Stockbridge: | 2.3 |
| Jonesboro: | 1.1 |
| Jackson: | 0.8 |
| Griffin: | 2.1 |
| Riverdale: | 1.0 |
| Conyers: | 3.2 |
| Fayetteville: | 1.7 |
| Lithonia: | 1.6 |
 According to the data from the years 2002 - 2018 the average number of fire-related casualties per year is 2. The highest number of casualties - 7 took place in 2010, and the lowest - 0 in 2005. The data has a decreasing trend.
The average number of injuries per 1,000 fires is 9. This indicator was the highest - 80 in 2003, and the lowest 0 in 2005. The trend for injuries per 1,000 incidents is decreasing. Compared to the state value the number of injuries per 1,000 fire incidents is lower.
According to the data from the years 2002 - 2018 the average number of fire-related casualties per year is 2. The highest number of casualties - 7 took place in 2010, and the lowest - 0 in 2005. The data has a decreasing trend.
The average number of injuries per 1,000 fires is 9. This indicator was the highest - 80 in 2003, and the lowest 0 in 2005. The trend for injuries per 1,000 incidents is decreasing. Compared to the state value the number of injuries per 1,000 fire incidents is lower.Casualties per 1,000 incidents in McDonough, GA compared to nearest cities:
(Note: Based on data for all years, including only cities with at least 500 fire incidents)
| McDonough: | 5.9 |
| Locust Grove: | 6.1 |
| Stockbridge: | 11.6 |
| Hampton: | 6.7 |
| Jonesboro: | 11.6 |
| Morrow: | 13.0 |
| Jackson: | 2.0 |
| Griffin: | 10.2 |
| Riverdale: | 10.6 |
 25.1% incidents where reported in the morning and 74.9% in the evening. The most fires (16.6%) took place on Saturday, and the least (13.3%) on Wednesday.
 Based on the 5,402 fire incident reports from years 2002 - 2018 most fires (10.6%) took place during March, and the least (5.8%) in August.
 Out of all 53,469 cases reported during the years 2002 - 2018, the most belonged to the categories: Rescue & EMS (64.8%), Fire (10.1%), and Good Intent Call (7.0%).
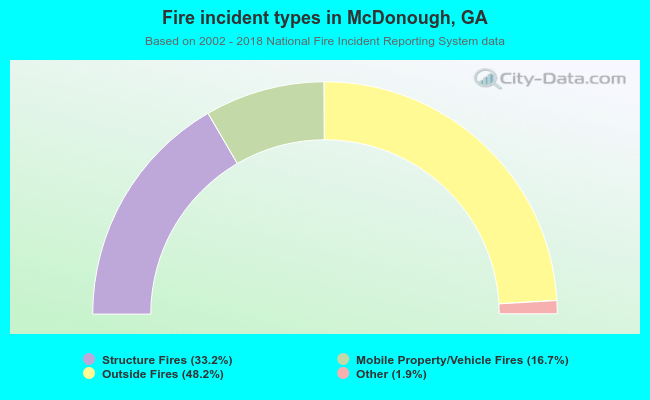 When looking into fire subcategories, the most incidents belonged to: Outside Fires (48.2%), and Structure Fires (33.2%).