Copperas Cove: Fire Incidents, Texas (TX)
Where are fire incidents reported in Copperas Cove, TX
Something went wrong! Please refresh the page.
| Fire incidents reported | |
|---|---|
| Sreet name | Count |
| 190 HWY | 402 |
| 116 FM | 114 |
| MAIN ST | 110 |
| B AVE | 100 |
| D AVE | 64 |
| KUBITZ RD | 56 |
| LUTHERAN CHURCH RD | 56 |
| ROBERTSON AVE | 44 |
| 1113 FM | 42 |
| 23RD ST | 42 |
| VETERANS AVE | 42 |
| 1ST ST | 40 |
| SUNSET LANE | 40 |
| COURTNEY LANE | 38 |
| JUDY LANE | 38 |
| OAKALLA RD | 38 |
| TWIN MOUNTAIN RD | 38 |
| 116 | 36 |
| 3046 FM | 36 |
| ERBY AVE | 36 |
| HOGAN DR | 36 |
| 19TH ST | 34 |
| BIG DIVIDE RD | 34 |
| 11TH ST | 32 |
| 25TH ST | 32 |
| BLUESTEM DR | 32 |
| URBANTKE CT | 32 |
| LEONHARD ST | 30 |
| NORTHERN DOVE LANE | 28 |
| 3RD ST | 26 |
| Other | 930 |
2002 - 2018 National Fire Incident Reporting System (NFIRS) incidents
- Incident types reported to NFIRS in Copperas Cove, TX
- 16,11567.3%Rescue & EMS
- 2,65811.1%Fire
- 2,52610.5%Hazardous Condition
- 1,0804.5%Good Intent Call
- 9113.8%Service Call
- 6492.7%False Alarm
- Fire incident types reported to NFIRS in Copperas Cove, TX
- 1,49656.3%Outside Fires
- 74728.1%Structure Fires
- 30111.3%Mobile Property/Vehicle Fires
- 1144.3%Other
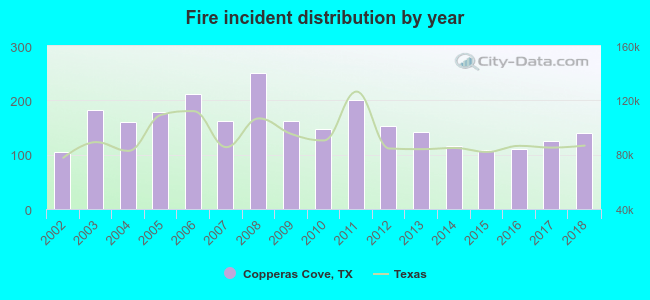 Based on the data from the years 2002 - 2018 the average number of fire incidents per year is 156. The highest number of fires - 251 took place in 2008, and the least - 105 in 2002. The data has a rising trend.
The average number of yearly fire incidents per 10k residents in Copperas Cove, TX compared to nearest cities:
(Note: Based on data for the last 3 years, including only cities with population 5,000 and above)
| Copperas Cove: | 38.1 |
| Fort Hood: | 0.7 |
| Killeen: | 35.7 |
| Harker Heights: | 32.6 |
| Lampasas: | 98.3 |
| Gatesville: | 122.6 |
| Belton: | 41.4 |
| Jarrell: | 52.8 |
| Burnet: | 264.5 |
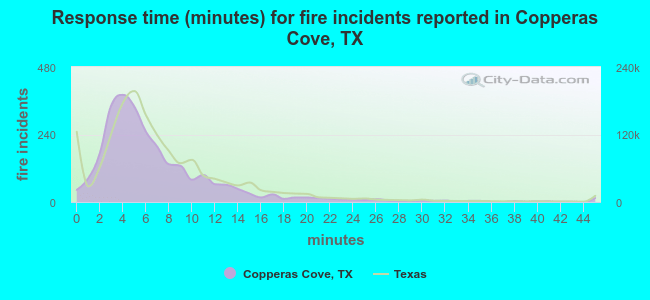 The median response time based on all reported fire incidents is 5 minutes. This is lower compared to the state median value.
The median response time in Copperas Cove, TX compared to nearest cities:
(Note: Based on data for all years, including only cities with at least 500 fire incidents)
| Copperas Cove: | 5 minutes |
| Kempner: | 13 minutes |
| Killeen: | 6 minutes |
| Harker Heights: | 6 minutes |
| Lampasas: | 10 minutes |
| Florence: | 10 minutes |
| Gatesville: | 10 minutes |
| Salado: | 9 minutes |
| Belton: | 7 minutes |
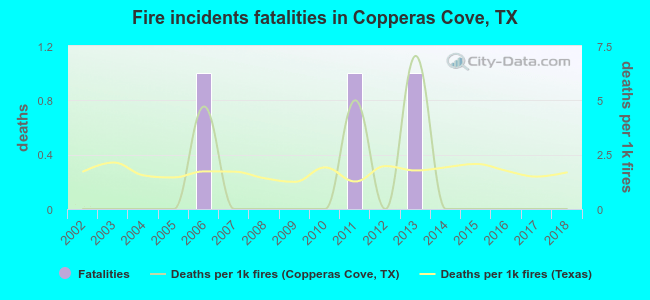 Based on the reports from the years 2002 - 2018 the average number of fire-related fatalities per year is 0. The highest number of reported deaths - 1 took place in 2006, and the lowest - 0 in 2002. The data has a constant trend.
The average number of fatalities per 1,000 fire incidents is 1. This indicator was the highest - 7 in 2013, and the lowest 0 in 2002. The trend for deaths per 1,000 incidents is constant. Compared to the state value the number of fatalities per 1,000 incidents is lower.
Based on the reports from the years 2002 - 2018 the average number of fire-related fatalities per year is 0. The highest number of reported deaths - 1 took place in 2006, and the lowest - 0 in 2002. The data has a constant trend.
The average number of fatalities per 1,000 fire incidents is 1. This indicator was the highest - 7 in 2013, and the lowest 0 in 2002. The trend for deaths per 1,000 incidents is constant. Compared to the state value the number of fatalities per 1,000 incidents is lower.Deaths per 1,000 incidents in Copperas Cove, TX compared to nearest cities:
(Note: Based on data for all years, including only cities with at least 2,500 fire incidents)
| Copperas Cove: | 1.1 |
| Killeen: | 1.8 |
| Gatesville: | 2.9 |
| Temple: | 2.9 |
| Georgetown: | 1.2 |
| Round Rock: | 0.7 |
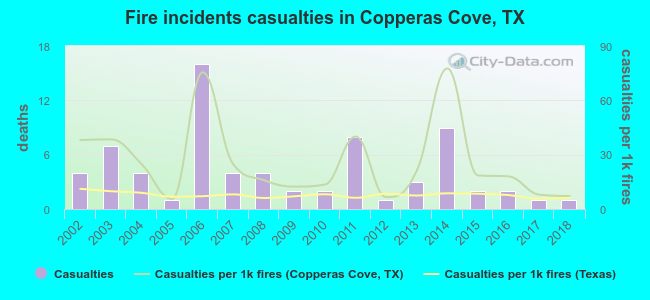 Based on the reports from the years 2002 - 2018 the average number of fire-related casualties per year is 4. The highest number of reported injuries - 16 took place in 2006, and the lowest - 1 in 2005. The data has a decreasing trend.
The average number of injuries per 1,000 fires is 26. This indicator was the highest - 78 in 2014, and the lowest 6 in 2005. The trend for casualties per 1,000 incidents is declining. Compared to the state value the number of casualties per 1,000 fire incidents is much higher.
Based on the reports from the years 2002 - 2018 the average number of fire-related casualties per year is 4. The highest number of reported injuries - 16 took place in 2006, and the lowest - 1 in 2005. The data has a decreasing trend.
The average number of injuries per 1,000 fires is 26. This indicator was the highest - 78 in 2014, and the lowest 6 in 2005. The trend for casualties per 1,000 incidents is declining. Compared to the state value the number of casualties per 1,000 fire incidents is much higher.Casualties per 1,000 incidents in Copperas Cove, TX compared to nearest cities:
(Note: Based on data for all years, including only cities with at least 500 fire incidents)
| Copperas Cove: | 26.7 |
| Kempner: | 4.6 |
| Killeen: | 13.0 |
| Harker Heights: | 16.6 |
| Lampasas: | 4.5 |
| Florence: | 7.4 |
| Gatesville: | 11.2 |
| Salado: | 0.0 |
| Belton: | 9.1 |
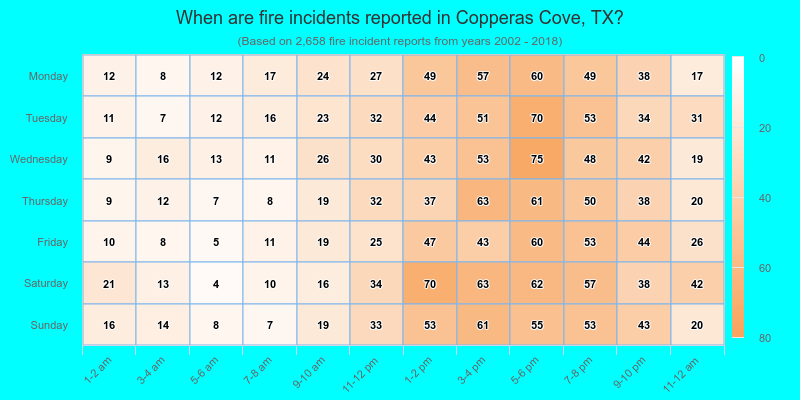
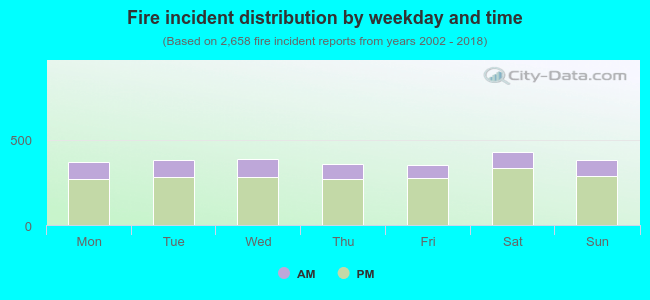 25.1% incidents where reported in the morning and 74.9% in the evening. The most fires (16.2%) took place on Saturday, and the least (13.2%) on Friday.
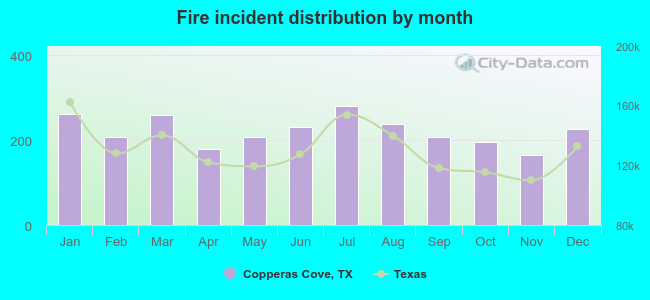 Based on the 2,658 incident reports from years 2002 - 2018 most fires (10.6%) took place during July, and the least (6.2%) in November.
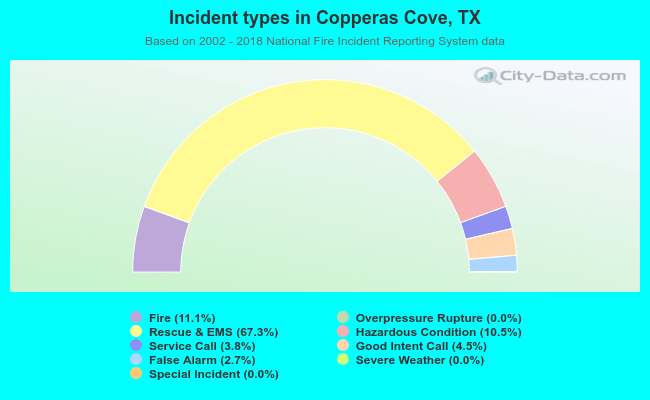 Out of all 23,962 cases reported during the years 2002 - 2018, the most belonged to the categories: Rescue & EMS (67.3%), Fire (11.1%), and Hazardous Condition (10.5%).
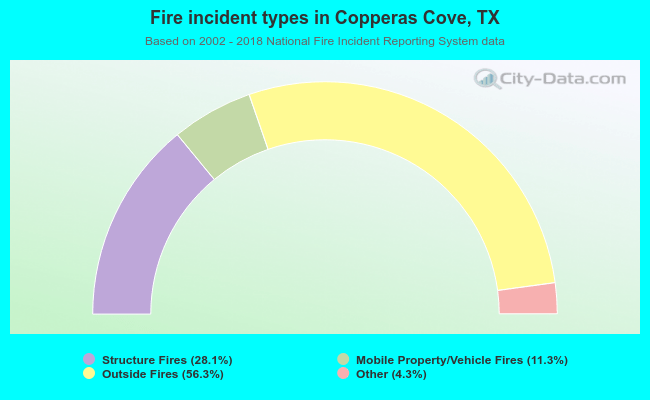 When looking into fire subcategories, the most reports belonged to: Outside Fires (56.3%), and Structure Fires (28.1%).