Round Rock: Fire Incidents, Texas (TX)
Where are fire incidents reported in Round Rock, TX
Something went wrong! Please refresh the page.
| Fire incidents reported | |
|---|---|
| Sreet name | Count |
| IH 35 | 524 |
| PALM VALLEY BLVD | 336 |
| LOUIS HENNA BLVD | 244 |
| IH 35 FR | 202 |
| MAYS ST | 148 |
| OLD SETTLERS BLVD | 118 |
| IH 35 FWY | 116 |
| GATTIS SCHOOL RD | 112 |
| SUNRISE RD | 108 |
| GREENLAWN BLVD | 98 |
| LA FRONTERA BLVD | 98 |
| I H 35 | 90 |
| ROUND ROCK AVE | 74 |
| SAM BASS RD | 74 |
| CHISHOLM VALLEY DR | 72 |
| UNIVERSITY BLVD | 70 |
| AW GRIMES BLVD | 68 |
| 620 RR | 64 |
| GREAT OAKS DR | 64 |
| 620 FM | 58 |
| MCNEIL RD | 56 |
| LAWNMONT DR | 54 |
| MAIN ST | 48 |
| A W GRIMES BLVD | 46 |
| O'CONNER DR | 46 |
| BOWMAN RD | 40 |
| CHISHOLM TRAIL RD | 40 |
| FOREST CREEK DR | 40 |
| WILLOWBEND DR | 40 |
| GEORGETOWN ST | 36 |
| Other | 1,115 |
2002 - 2018 National Fire Incident Reporting System (NFIRS) incidents
- Incident types reported to NFIRS in Round Rock, TX
- 27,58057.1%Rescue & EMS
- 4,91610.2%Good Intent Call
- 4,4629.2%Hazardous Condition
- 4,2998.9%Fire
- 3,5237.3%Service Call
- 2,8115.8%False Alarm
- 6561.4%Special Incident
- Fire incident types reported to NFIRS in Round Rock, TX
- 1,89444.1%Outside Fires
- 1,43133.3%Structure Fires
- 76017.7%Mobile Property/Vehicle Fires
- 2145.0%Other
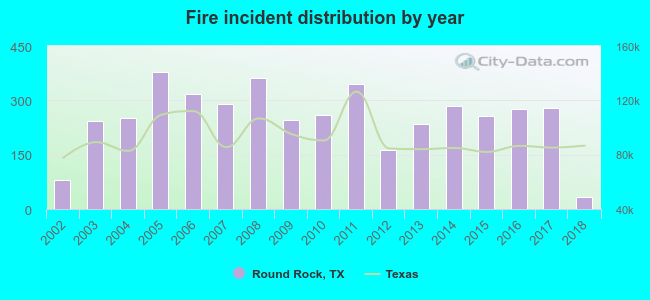 Based on the data from the years 2002 - 2018 the average number of fire incidents per year is 253. The highest number of reported fire incidents - 377 took place in 2005, and the least - 33 in 2018. The data has a declining trend.
The average number of yearly fire incidents per 10k residents in Round Rock, TX compared to nearest cities:
(Note: Based on data for the last 3 years, including only cities with population 5,000 and above)
| Round Rock: | 17.3 |
| Pflugerville: | 20.1 |
| Jollyville: | 0.6 |
| Hutto: | 42.8 |
| Cedar Park: | 18.8 |
| Georgetown: | 32.1 |
| Leander: | 38.0 |
| Manor: | 38.5 |
| Austin: | 17.6 |
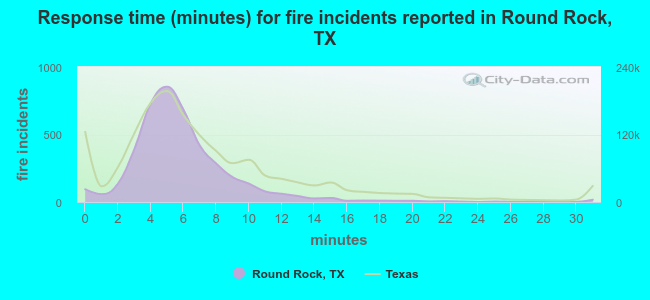 The median response time based on all reported fire incidents is 5 minutes. This is lower than the state median value.
The median response time in Round Rock, TX compared to nearest cities:
(Note: Based on data for all years, including only cities with at least 500 fire incidents)
| Round Rock: | 5 minutes |
| Pflugerville: | 7 minutes |
| Hutto: | 8 minutes |
| Cedar Park: | 6 minutes |
| Georgetown: | 7 minutes |
| Leander: | 7 minutes |
| Manor: | 8 minutes |
| Austin: | 5 minutes |
| Taylor: | 7 minutes |
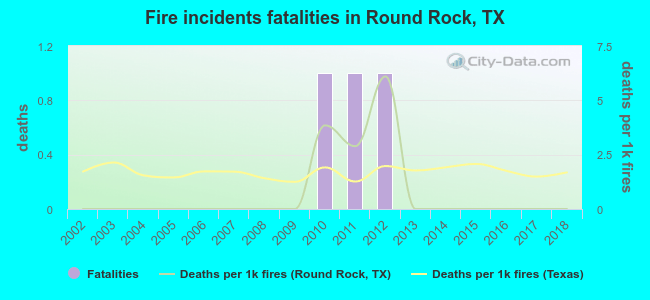 According to the reports from the years 2002 - 2018 the average number of fire-related yearly deaths is 0. The highest number of deaths - 1 took place in 2010, and the lowest - 0 in 2002. The data has a constant trend.
The average number of fatalities per 1,000 fires is 1. This indicator was the highest - 6 in 2012, and the lowest 0 in 2002. The trend for fatalities per 1,000 incidents is constant. Compared to the state value the number of fatalities per 1,000 fires is much lower.
According to the reports from the years 2002 - 2018 the average number of fire-related yearly deaths is 0. The highest number of deaths - 1 took place in 2010, and the lowest - 0 in 2002. The data has a constant trend.
The average number of fatalities per 1,000 fires is 1. This indicator was the highest - 6 in 2012, and the lowest 0 in 2002. The trend for fatalities per 1,000 incidents is constant. Compared to the state value the number of fatalities per 1,000 fires is much lower.Deaths per 1,000 incidents in Round Rock, TX compared to nearest cities:
(Note: Based on data for all years, including only cities with at least 2,500 fire incidents)
| Round Rock: | 0.7 |
| Georgetown: | 1.2 |
| Austin: | 1.8 |
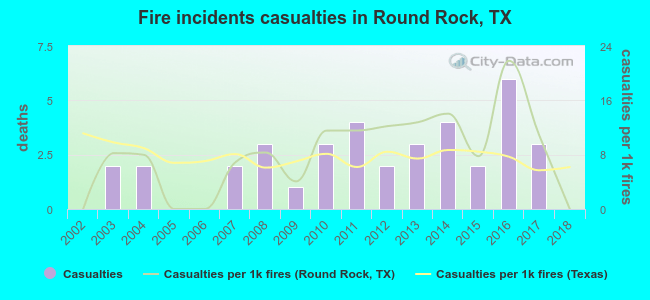 Based on the data from the years 2002 - 2018 the average number of fire-related yearly casualties is 2. The highest number of reported injuries - 6 took place in 2016, and the lowest - 0 in 2002. The data has a constant trend.
The average number of injuries per 1,000 fires is 8. This indicator was the highest - 22 in 2016, and the lowest 0 in 2002. The trend for injuries per 1,000 fires is constant. Compared to the Texas value the number of casualties per 1,000 fires is similar.
Based on the data from the years 2002 - 2018 the average number of fire-related yearly casualties is 2. The highest number of reported injuries - 6 took place in 2016, and the lowest - 0 in 2002. The data has a constant trend.
The average number of injuries per 1,000 fires is 8. This indicator was the highest - 22 in 2016, and the lowest 0 in 2002. The trend for injuries per 1,000 fires is constant. Compared to the Texas value the number of casualties per 1,000 fires is similar.Casualties per 1,000 incidents in Round Rock, TX compared to nearest cities:
(Note: Based on data for all years, including only cities with at least 500 fire incidents)
| Round Rock: | 8.6 |
| Pflugerville: | 2.1 |
| Hutto: | 3.5 |
| Cedar Park: | 5.9 |
| Georgetown: | 10.4 |
| Leander: | 4.2 |
| Manor: | 2.5 |
| Austin: | 15.1 |
| Taylor: | 8.7 |
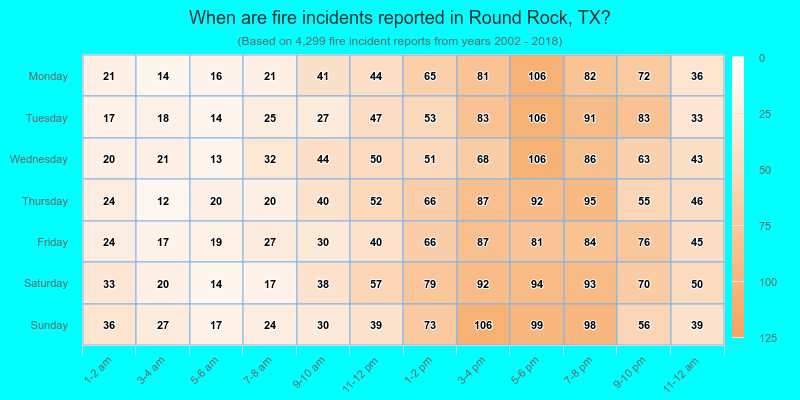
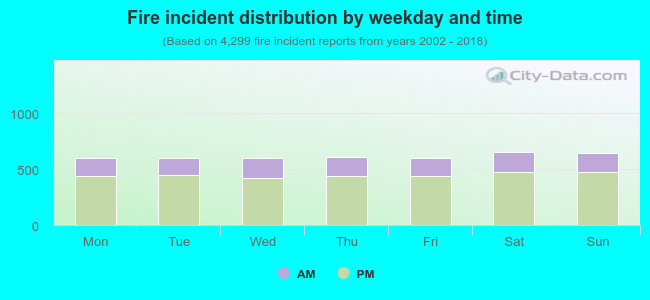 27.0% incidents where reported in the morning and 73.0% in the evening. The most fires (15.3%) took place on Saturday, and the least (13.9%) on Friday.
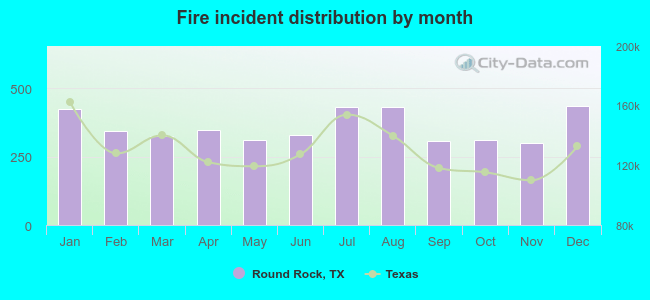 According to the 4,299 reports from years 2002 - 2018 most fires (10.2%) took place during December, and the least (7.0%) in November.
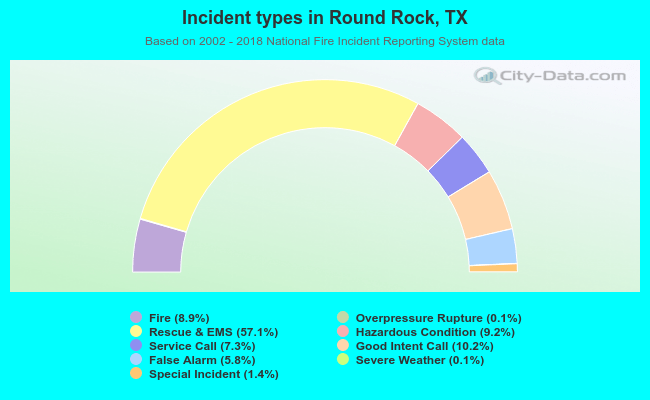 Out of all 48,321 cases reported during the years 2002 - 2018, the most belonged to the categories: Rescue & EMS (57.1%), Good Intent Call (10.2%), and Hazardous Condition (9.2%).
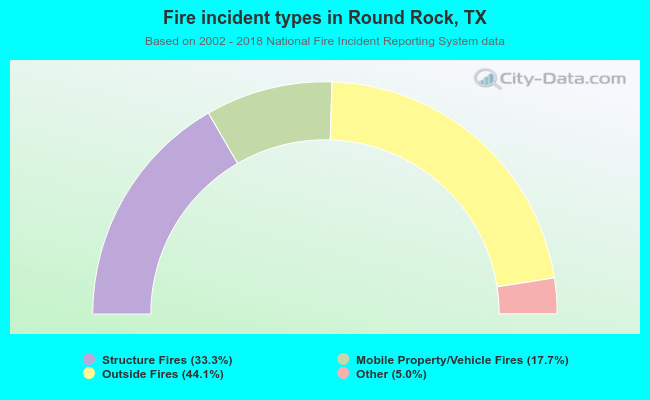 When looking into fire subcategories, the most reports belonged to: Outside Fires (44.1%), and Structure Fires (33.3%).