Corbin: Fire Incidents, Kentucky (KY)
Where are fire incidents reported in Corbin, KY
Something went wrong! Please refresh the page.
| Fire incidents reported | |
|---|---|
| Sreet name | Count |
| MASTER ST | 106 |
| ENGINEER ST | 76 |
| CUMBERLAND GAP PKY | 74 |
| 1365 MASTER ST | 68 |
| 704 ENGINEER ST | 62 |
| CUMBERLAND FALLS HWY | 54 |
| 704 ENGINEER ST. | 48 |
| 1365 MASTER ST. | 46 |
| CUMBERLAND FALLS HIGHWAY HWY | 44 |
| 5TH ST | 26 |
| CTA BLVD | 24 |
| MAIN ST | 24 |
| 1232 HWY | 22 |
| 4TH ST | 22 |
| I-75 | 22 |
| INTERSTATE 75 HWY | 22 |
| KENTUCKY AVE | 22 |
| 1 TRILLIUM WAY | 20 |
| 25E | 20 |
| I-75 FWY | 20 |
| OTT ROAD | 20 |
| 1223 HWY | 18 |
| 1375 MASTER ST | 18 |
| 830 HWY | 18 |
| AMERICAN GREETING CARD RD | 18 |
| 704 ENGINEER STREET | 16 |
| BARBOURVILLE ST | 16 |
| CUMBERLAND FALLS HWY | 16 |
| GORDON HILL PIKE | 16 |
| HWY 1232 | 16 |
| Other | 1,700 |
2002 - 2018 National Fire Incident Reporting System (NFIRS) incidents
- Incident types reported to NFIRS in Corbin, KY
- 3,24533.7%Rescue & EMS
- 2,69428.0%Fire
- 1,25813.1%Service Call
- 99210.3%False Alarm
- 6987.2%Good Intent Call
- 6366.6%Hazardous Condition
- 490.5%Special Incident
- 390.4%Severe Weather
- 250.3%Overpressure Rupture
- Fire incident types reported to NFIRS in Corbin, KY
- 1,16943.4%Structure Fires
- 90233.5%Outside Fires
- 39214.6%Mobile Property/Vehicle Fires
- 2318.6%Other
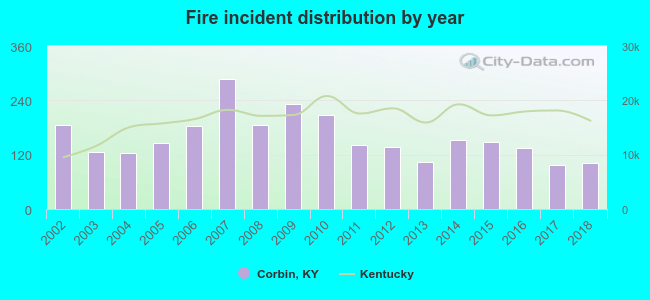 Based on the data from the years 2002 - 2018 the average number of fires per year is 158. The highest number of reported fires - 287 took place in 2007, and the least - 97 in 2017. The data has a declining trend.
The average number of yearly fire incidents per 10k residents in Corbin, KY compared to nearest cities:
(Note: Based on data for the last 3 years, including only cities with population 5,000 and above)
| Corbin: | 151.9 |
| Keavy: | 3.3 |
| London: | 195.7 |
| Williamsburg: | 231.3 |
| Somerset: | 154.4 |
| Nancy: | 32.2 |
 The median response time based on all reported fire incidents is 6 minutes. This is similar to the Kentucky median value.
The median response time in Corbin, KY compared to nearest cities:
(Note: Based on data for all years, including only cities with at least 500 fire incidents)
| Corbin: | 6 minutes |
| London: | 8 minutes |
| Barbourville: | 6 minutes |
| Williamsburg: | 10 minutes |
| East Bernstadt: | 10 minutes |
| Manchester: | 10 minutes |
| Pineville: | 9 minutes |
| Somerset: | 7 minutes |
| Science Hill: | 9 minutes |
 According to the data from the years 2002 - 2018 the average number of fire-related fatalities per year is 0. The highest number of reported deaths - 1 took place in 2003, and the lowest - 0 in 2002. The data has a constant trend.
The average number of fatalities per 1,000 fires is 1. This indicator was the highest - 8 in 2003, and the lowest 0 in 2002. The trend for fatalities per 1,000 fire incidents is constant. Compared to the Kentucky value the number of deaths per 1,000 fires is lower.
According to the data from the years 2002 - 2018 the average number of fire-related fatalities per year is 0. The highest number of reported deaths - 1 took place in 2003, and the lowest - 0 in 2002. The data has a constant trend.
The average number of fatalities per 1,000 fires is 1. This indicator was the highest - 8 in 2003, and the lowest 0 in 2002. The trend for fatalities per 1,000 fire incidents is constant. Compared to the Kentucky value the number of deaths per 1,000 fires is lower.
 According to the data from the years 2002 - 2018 the average number of fire-related yearly casualties is 1. The highest number of reported casualties - 3 took place in 2006, and the lowest - 0 in 2002. The data has an increasing trend.
The average number of injuries per 1,000 fire incidents is 3. This indicator was the highest - 16 in 2006, and the lowest 0 in 2002. The trend for casualties per 1,000 fires is increasing. Compared to the Kentucky value the number of casualties per 1,000 fires is much lower.
According to the data from the years 2002 - 2018 the average number of fire-related yearly casualties is 1. The highest number of reported casualties - 3 took place in 2006, and the lowest - 0 in 2002. The data has an increasing trend.
The average number of injuries per 1,000 fire incidents is 3. This indicator was the highest - 16 in 2006, and the lowest 0 in 2002. The trend for casualties per 1,000 fires is increasing. Compared to the Kentucky value the number of casualties per 1,000 fires is much lower.Casualties per 1,000 incidents in Corbin, KY compared to nearest cities:
(Note: Based on data for all years, including only cities with at least 500 fire incidents)
| Corbin: | 3.3 |
| London: | 3.2 |
| Barbourville: | 0.0 |
| Williamsburg: | 13.2 |
| East Bernstadt: | 0.0 |
| Manchester: | 2.6 |
| Pineville: | 0.0 |
| Somerset: | 1.6 |
| Science Hill: | 0.0 |
 31.6% incidents where reported in the morning and 68.4% in the evening. The most fires (16.0%) took place on Saturday, and the least (12.2%) on Wednesday.
 According to the 2,694 reports from years 2002 - 2018 most fires (13.7%) took place during March, and the least (6.3%) in December.
 Out of all 9,636 cases reported during the years 2002 - 2018, the most belonged to the categories: Rescue & EMS (33.7%), Fire (28.0%), and Service Call (13.1%).
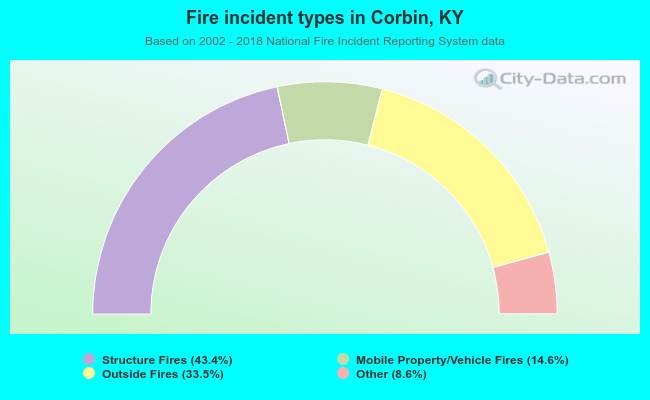 When looking into fire subcategories, the most incidents belonged to: Structure Fires (43.4%), and Outside Fires (33.5%).