Pineville: Fire Incidents, Kentucky (KY)
Where are fire incidents reported in Pineville, KY
Something went wrong! Please refresh the page.
|
| |||||||||||||||||||||||||||||||||||||||||||||||||||||||||||||||||||||||||||||||||||||||||||||||||||||||||||||
| Other | 189 | |||||||||||||||||||||||||||||||||||||||||||||||||||||||||||||||||||||||||||||||||||||||||||||||||||||||||||||
2002 - 2018 National Fire Incident Reporting System (NFIRS) incidents
- Incident types reported to NFIRS in Pineville, KY
- 60349.3%Fire
- 27622.5%Rescue & EMS
- 13210.8%Hazardous Condition
- 836.8%False Alarm
- 564.6%Special Incident
- 494.0%Good Intent Call
- 201.6%Service Call
- 30.2%Overpressure Rupture
- 20.2%Severe Weather
- Fire incident types reported to NFIRS in Pineville, KY
- 27245.1%Structure Fires
- 16226.9%Outside Fires
- 9014.9%Mobile Property/Vehicle Fires
- 7913.1%Other
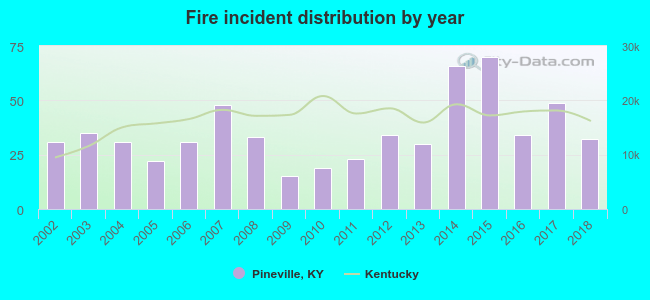 Based on the data from the years 2002 - 2018 the average number of fires per year is 35. The highest number of reported fire incidents - 70 took place in 2015, and the least - 15 in 2009. The data has a rising trend.
 The median response time based on all reported fire incidents is 9 minutes. This is higher than the Kentucky median value.
The median response time in Pineville, KY compared to nearest cities:
(Note: Based on data for all years, including only cities with at least 500 fire incidents)
| Pineville: | 9 minutes |
| Barbourville: | 6 minutes |
| Corbin: | 6 minutes |
| Williamsburg: | 10 minutes |
| Manchester: | 10 minutes |
| London: | 8 minutes |
| East Bernstadt: | 10 minutes |
 33.2% incidents where reported in the morning and 66.8% in the evening. The most fires (16.7%) took place on Saturday, and the least (11.8%) on Thursday.
 According to the 603 fire incident reports from years 2002 - 2018 most fires (14.1%) took place during March, and the least (4.6%) in June.
 Out of all 1,224 cases reported during the years 2002 - 2018, the most belonged to the categories: Fire (49.3%), Rescue & EMS (22.5%), and Hazardous Condition (10.8%).
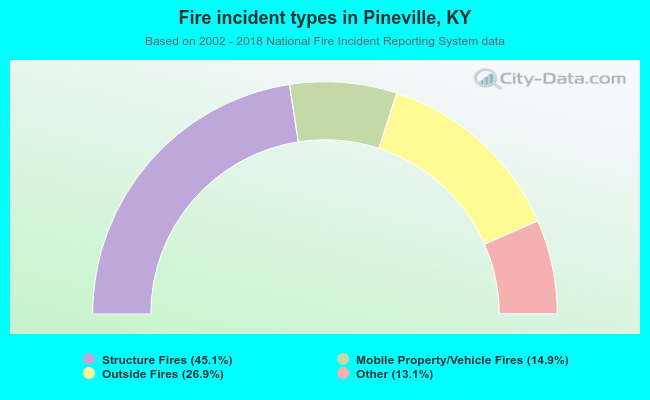 When looking into fire subcategories, the most reports belonged to: Structure Fires (45.1%), and Outside Fires (26.9%).