Coventry: Fire Incidents, Rhode Island (RI)
Where are fire incidents reported in Coventry, RI
Something went wrong! Please refresh the page.
|
| |||||||||||||||||||||||||||||||||||||||||||||||||||||||||||||||||||||||||||||||||||||||||||||||||||||||||||||
| Other | 205 | |||||||||||||||||||||||||||||||||||||||||||||||||||||||||||||||||||||||||||||||||||||||||||||||||||||||||||||
2003 - 2018 National Fire Incident Reporting System (NFIRS) incidents
- Incident types reported to NFIRS in Coventry, RI
- 81023.4%Rescue & EMS
- 67919.6%Fire
- 61717.8%Hazardous Condition
- 56216.2%False Alarm
- 50614.6%Good Intent Call
- 2386.9%Service Call
- 361.0%Overpressure Rupture
- 120.3%Special Incident
- Fire incident types reported to NFIRS in Coventry, RI
- 35652.4%Structure Fires
- 16724.6%Outside Fires
- 9514.0%Other
- 619.0%Mobile Property/Vehicle Fires
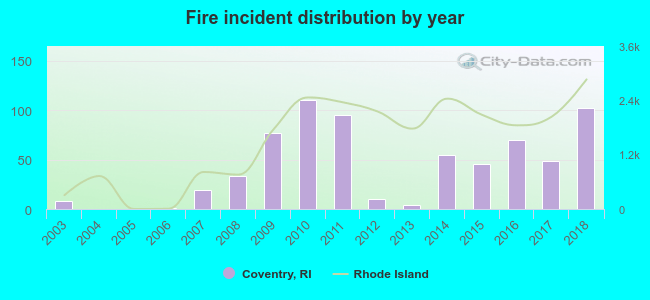 Based on the data from the years 2003 - 2018 the average number of fire incidents per year is 42. The highest number of fires - 110 took place in 2010, and the least - 0 in 2004. The data has a rising trend.
The average number of yearly fire incidents per 10k residents in Coventry, RI compared to nearest cities:
(Note: Based on data for the last 3 years, including only cities with population 5,000 and above)
| Coventry: | 21.0 |
| West Warwick: | 79.6 |
| West Greenwich: | 62.5 |
| Scituate: | 3.9 |
| East Greenwich: | 23.6 |
| Exeter: | 64.9 |
| Cranston: | 25.6 |
| Warwick: | 0.3 |
| Johnston: | 26.6 |
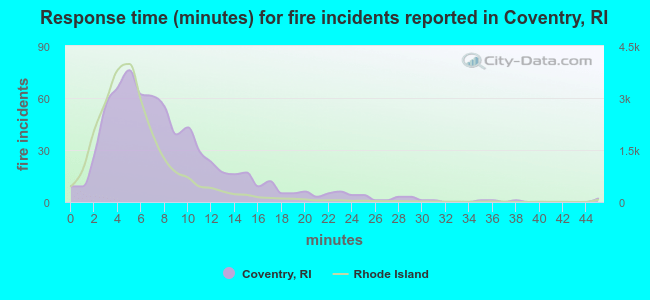 The median response time based on all reported fire incidents is 7 minutes. This is higher compared to the state median value.
The median response time in Coventry, RI compared to nearest cities:
(Note: Based on data for all years, including only cities with at least 500 fire incidents)
| Coventry: | 7 minutes |
| West Warwick: | 3 minutes |
| Cranston: | 4 minutes |
| Warwick: | 4 minutes |
| Providence: | 5 minutes |
| North Providence: | 4 minutes |
| Smithfield: | 6 minutes |
| East Providence: | 5 minutes |
| Moosup: | 8 minutes |
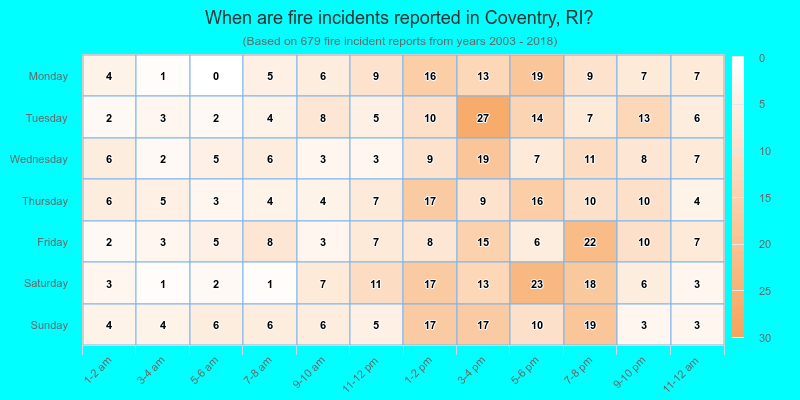
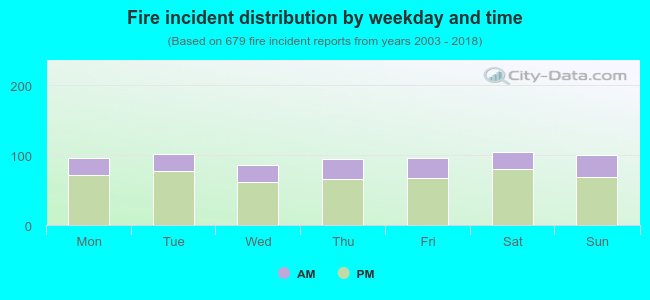 27.5% incidents where reported in the morning and 72.5% in the evening. The most fires (15.5%) took place on Saturday, and the least (12.7%) on Wednesday.
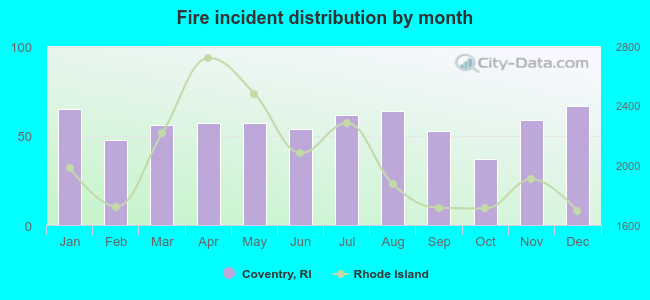 According to the 679 fire incidents from years 2003 - 2018 most fires (9.9%) took place during December, and the least (5.4%) in October.
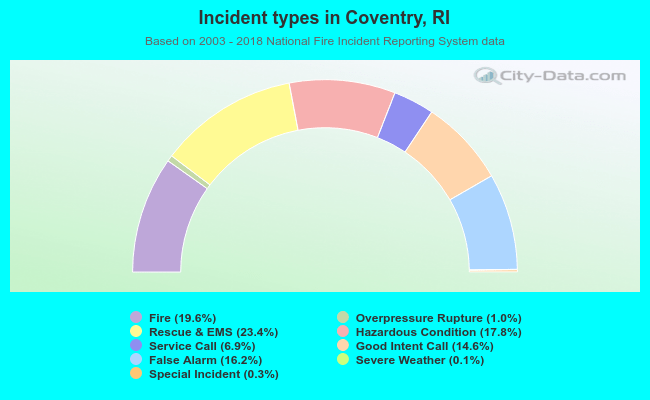 Out of all 3,462 cases reported during the years 2003 - 2018, the most belonged to the categories: Rescue & EMS (23.4%), Fire (19.6%), and Hazardous Condition (17.8%).
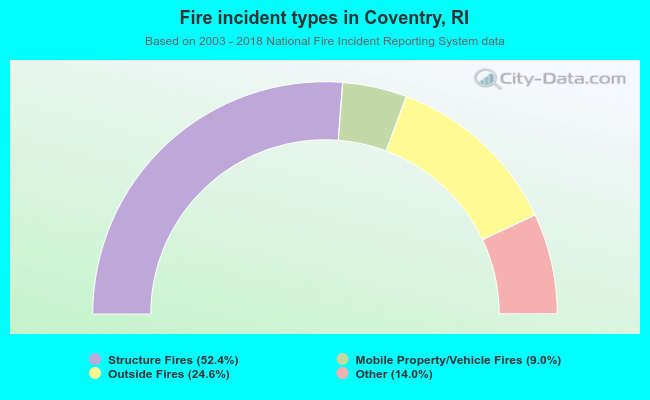 When looking into fire subcategories, the most reports belonged to: Structure Fires (52.4%), and Outside Fires (24.6%).