West Greenwich: Fire Incidents, Rhode Island (RI)
Where are fire incidents reported in West Greenwich, RI
Something went wrong! Please refresh the page.
|
| |||||||||||||||||||||||||||||||||||||||||||||||||||||||||||||||||||||||||||||||||||||||||||||||||||||||||||||
2003 - 2018 National Fire Incident Reporting System (NFIRS) incidents
- Incident types reported to NFIRS in West Greenwich, RI
- 2,03472.2%Rescue & EMS
- 34212.1%False Alarm
- 1866.6%Fire
- 1073.8%Hazardous Condition
- 672.4%Good Intent Call
- 572.0%Service Call
- 130.5%Severe Weather
- 80.3%Special Incident
- Fire incident types reported to NFIRS in West Greenwich, RI
- 7741.4%Outside Fires
- 6233.3%Structure Fires
- 3116.7%Mobile Property/Vehicle Fires
- 168.6%Other
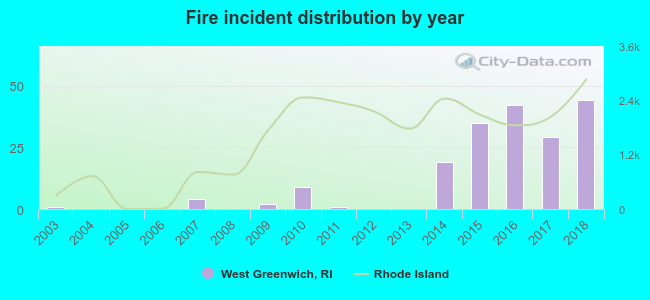 According to the data from the years 2003 - 2018 the average number of fire incidents per year is 12. The highest number of fire incidents - 44 took place in 2018, and the least - 0 in 2004. The data has a growing trend.
The average number of yearly fire incidents per 10k residents in West Greenwich, RI compared to nearest cities:
(Note: Based on data for the last 3 years, including only cities with population 5,000 and above)
| West Greenwich: | 62.5 |
| Exeter: | 64.9 |
| Coventry: | 21.0 |
| West Warwick: | 79.6 |
| Richmond: | 11.7 |
| East Greenwich: | 23.6 |
| Scituate: | 3.9 |
| North Kingstown: | 5.3 |
| Hopkinton: | 4.5 |
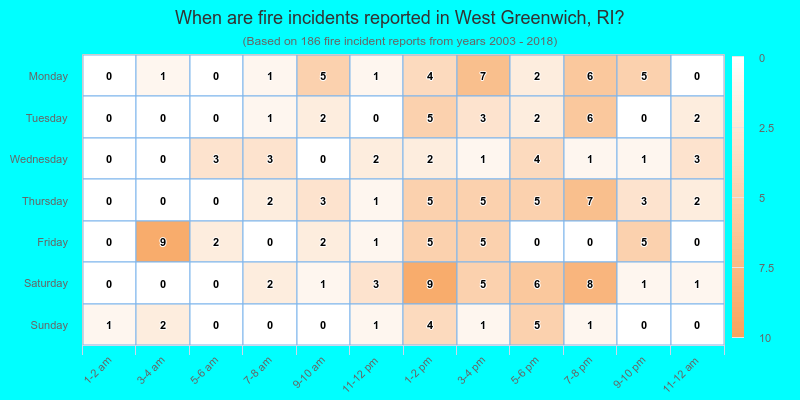
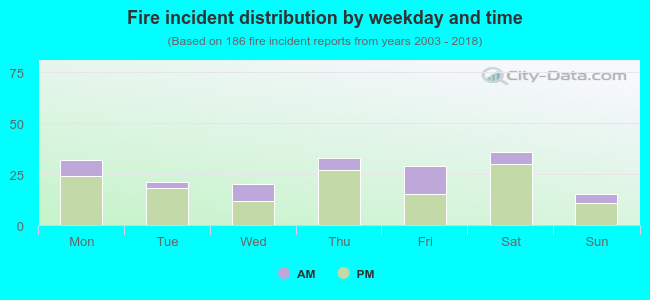 26.3% incidents where reported in the morning and 73.7% in the evening. The most fires (19.4%) took place on Saturday, and the least (8.1%) on Sunday.
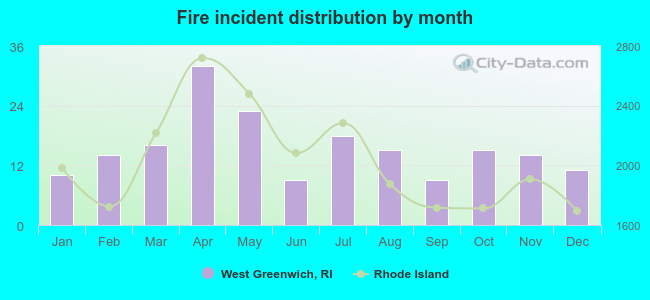 According to the 186 incident reports from years 2003 - 2018 most fires (17.2%) took place during April, and the least (4.8%) in June.
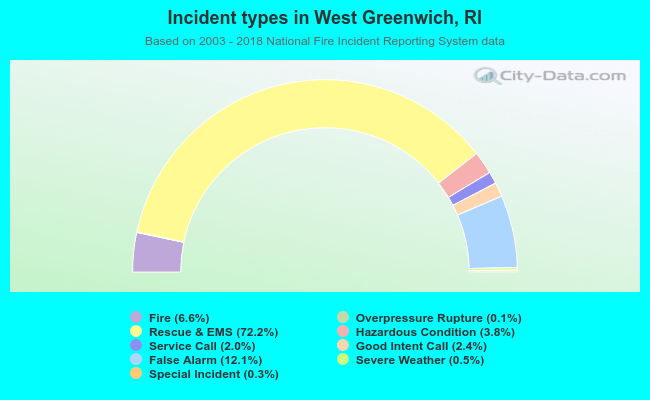 Out of all 2,816 cases reported during the years 2003 - 2018, the most belonged to the categories: Rescue & EMS (72.2%), False Alarm (12.1%), and Fire (6.6%).
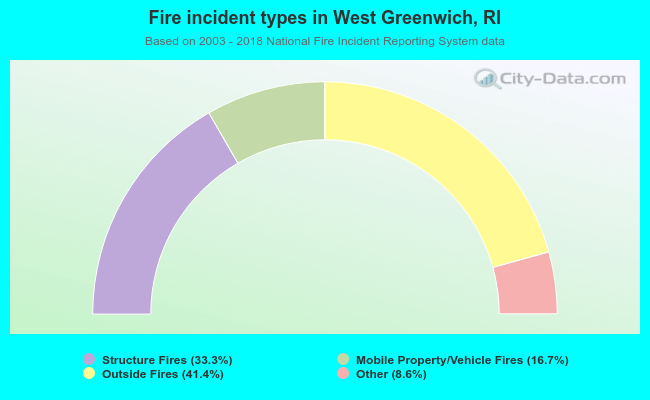 When looking into fire subcategories, the most incidents belonged to: Outside Fires (41.4%), and Structure Fires (33.3%).