Coweta: Fire Incidents, Oklahoma (OK)
Where are fire incidents reported in Coweta, OK
Something went wrong! Please refresh the page.
|
| |||||||||||||||||||||||||||||||||||||||||||||||||||||||||||||||||||||||||||||||||||||||||||||||||||||||||||||
| Other | 845 | |||||||||||||||||||||||||||||||||||||||||||||||||||||||||||||||||||||||||||||||||||||||||||||||||||||||||||||
2004 - 2018 National Fire Incident Reporting System (NFIRS) incidents
- Incident types reported to NFIRS in Coweta, OK
- 1,12735.0%Fire
- 1,09233.9%Rescue & EMS
- 41412.9%Hazardous Condition
- 32910.2%Good Intent Call
- 1574.9%Service Call
- 973.0%False Alarm
- Fire incident types reported to NFIRS in Coweta, OK
- 66959.4%Outside Fires
- 26523.5%Structure Fires
- 12511.1%Mobile Property/Vehicle Fires
- 686.0%Other
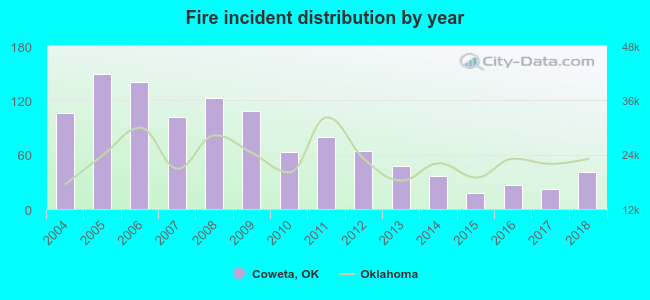 According to the data from the years 2004 - 2018 the average number of fires per year is 75. The highest number of fire incidents - 149 took place in 2005, and the least - 18 in 2015. The data has a declining trend.
The average number of yearly fire incidents per 10k residents in Coweta, OK compared to nearest cities:
(Note: Based on data for the last 3 years, including only cities with population 5,000 and above)
| Coweta: | 31.5 |
| Broken Arrow: | 20.0 |
| Bixby: | 20.1 |
| Wagoner: | 85.2 |
| Catoosa: | 95.6 |
| Jenks: | 35.9 |
| Glenpool: | 49.5 |
| Tulsa: | 50.9 |
| Muskogee: | 81.2 |
 The median response time based on all reported fire incidents is 6 minutes. This is close to the Oklahoma median value.
The median response time in Coweta, OK compared to nearest cities:
(Note: Based on data for all years, including only cities with at least 500 fire incidents)
| Coweta: | 6 minutes |
| Broken Arrow: | 6 minutes |
| Bixby: | 5 minutes |
| Inola: | 9 minutes |
| Wagoner: | 4 minutes |
| Catoosa: | 7 minutes |
| Jenks: | 5 minutes |
| Glenpool: | 4 minutes |
| Tulsa: | 4 minutes |
 25.4% incidents where reported in the morning and 74.6% in the evening. The most fires (17.1%) took place on Monday, and the least (11.1%) on Tuesday.
 According to the 1,127 incident reports from years 2004 - 2018 most fires (12.9%) took place during March, and the least (4.5%) in May.
 Out of all 3,219 cases reported during the years 2004 - 2018, the most belonged to the categories: Fire (35.0%), Overpressure Rupture (33.9%), and Rescue & EMS (12.9%).
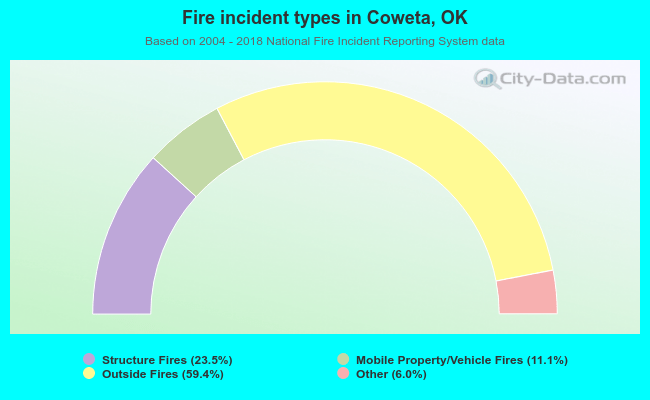 When looking into fire subcategories, the most reports belonged to: Outside Fires (59.4%), and Structure Fires (23.5%).