Wagoner: Fire Incidents, Oklahoma (OK)
Where are fire incidents reported in Wagoner, OK
Something went wrong! Please refresh the page.
|
| |||||||||||||||||||||||||||||||||||||||||||||||||||||||||||||||||||||||||||||||||||||||||||||||||||||||||||||
| Other | 728 | |||||||||||||||||||||||||||||||||||||||||||||||||||||||||||||||||||||||||||||||||||||||||||||||||||||||||||||
2005 - 2018 National Fire Incident Reporting System (NFIRS) incidents
- Incident types reported to NFIRS in Wagoner, OK
- 1,22836.2%Fire
- 65319.3%Hazardous Condition
- 65119.2%Service Call
- 36410.7%Rescue & EMS
- 2256.6%Good Intent Call
- 1695.0%False Alarm
- 661.9%Special Incident
- 270.8%Severe Weather
- 70.2%Overpressure Rupture
- Fire incident types reported to NFIRS in Wagoner, OK
- 73159.5%Outside Fires
- 21817.8%Structure Fires
- 14311.6%Mobile Property/Vehicle Fires
- 13611.1%Other
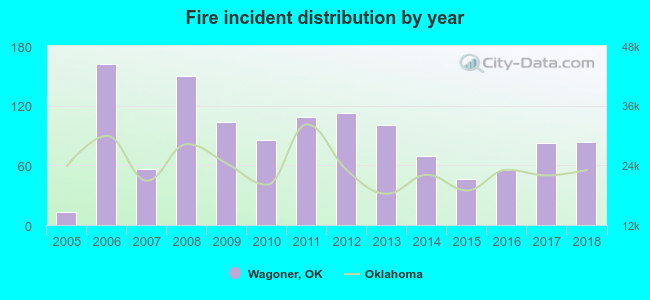 According to the data from the years 2005 - 2018 the average number of fire incidents per year is 88. The highest number of reported fires - 162 took place in 2006, and the least - 13 in 2005. The data has an increasing trend.
The average number of yearly fire incidents per 10k residents in Wagoner, OK compared to nearest cities:
(Note: Based on data for the last 3 years, including only cities with population 5,000 and above)
| Wagoner: | 85.2 |
| Muskogee: | 81.2 |
| Coweta: | 31.5 |
| Tahlequah: | 109.9 |
| Broken Arrow: | 20.0 |
| Catoosa: | 95.6 |
| Bixby: | 20.1 |
| Claremore: | 109.6 |
 The median response time based on all reported fire incidents is 4 minutes. This is lower than the state median value.
The median response time in Wagoner, OK compared to nearest cities:
(Note: Based on data for all years, including only cities with at least 500 fire incidents)
| Wagoner: | 4 minutes |
| Hulbert: | 5 minutes |
| Muskogee: | 5 minutes |
| Inola: | 9 minutes |
| Coweta: | 6 minutes |
| Chouteau: | 4 minutes |
| Locust Grove: | 7 minutes |
| Tahlequah: | 5 minutes |
| Broken Arrow: | 6 minutes |
 29.2% incidents where reported in the morning and 70.8% in the evening. The most fires (17.0%) took place on Saturday, and the least (10.0%) on Tuesday.
 Based on the 1,228 reports from years 2005 - 2018 most fires (12.8%) took place during January, and the least (5.9%) in October.
 Out of all 3,390 cases reported during the years 2005 - 2018, the most belonged to the categories: Fire (36.2%), Hazardous Condition (19.3%), and Service Call (19.2%).
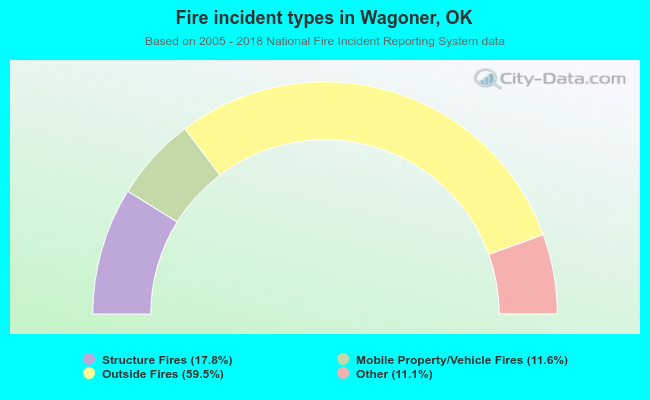 When looking into fire subcategories, the most incidents belonged to: Outside Fires (59.5%), and Structure Fires (17.8%).