Cranbury: Fire Incidents, New Jersey (NJ)
Where are fire incidents reported in Cranbury, NJ
Something went wrong! Please refresh the page.
|
| |||||||||||||||||||||||||||||||||||||||||||||||||||||||||||||||||||||||||||||||||||||||||||||||||||||||||||||
2004 - 2018 National Fire Incident Reporting System (NFIRS) incidents
- Incident types reported to NFIRS in Cranbury, NJ
- 92435.5%False Alarm
- 59122.7%Fire
- 47118.1%Good Intent Call
- 39715.3%Hazardous Condition
- 1556.0%Rescue & EMS
- 542.1%Service Call
- 50.2%Severe Weather
- 40.2%Overpressure Rupture
- Fire incident types reported to NFIRS in Cranbury, NJ
- 23639.9%Structure Fires
- 16928.6%Mobile Property/Vehicle Fires
- 16327.6%Outside Fires
- 233.9%Other
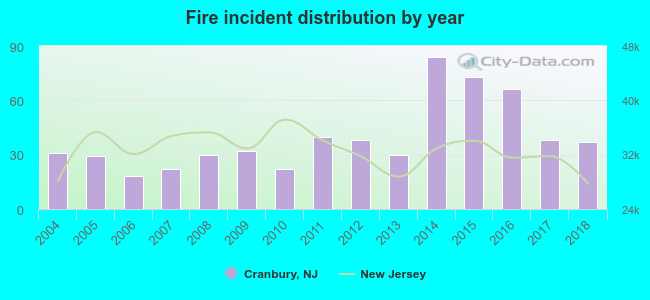 According to the data from the years 2004 - 2018 the average number of fires per year is 39. The highest number of reported fire incidents - 84 took place in 2014, and the least - 18 in 2006. The data has a rising trend.
 The median response time based on all reported fire incidents is 7 minutes. This is higher than the state median value.
The median response time in Cranbury, NJ compared to nearest cities:
(Note: Based on data for all years, including only cities with at least 500 fire incidents)
| Cranbury: | 7 minutes |
| Monmouth Junction: | 6 minutes |
| Princeton: | 8 minutes |
| Robbinsville: | 5 minutes |
| East Brunswick: | 5 minutes |
| Old Bridge: | 4 minutes |
| Lawrenceville: | 7 minutes |
| Morganville: | 4 minutes |
| Voorhees: | 6 minutes |
 34.7% incidents where reported in the morning and 65.3% in the evening. The most fires (17.8%) took place on Thursday, and the least (11.0%) on Sunday.
 According to the 591 fire incident reports from years 2004 - 2018 most fires (12.0%) took place during April, and the least (5.6%) in December.
 Out of all 2,602 cases reported during the years 2004 - 2018, the most belonged to the categories: False Alarm (35.5%), Fire (22.7%), and Good Intent Call (18.1%).
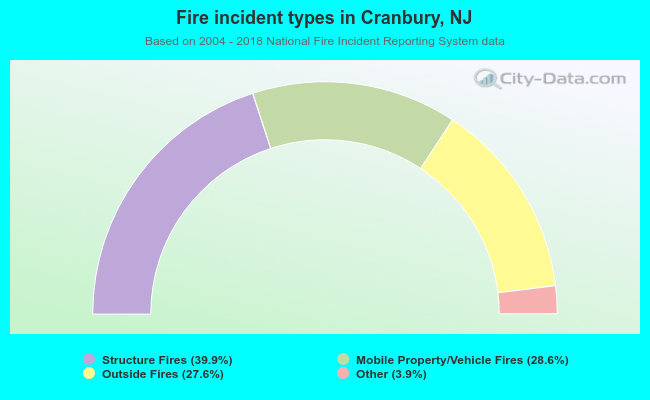 When looking into fire subcategories, the most reports belonged to: Structure Fires (39.9%), and Mobile Property/Vehicle Fires (28.6%).