Morganville: Fire Incidents, New Jersey (NJ)
Where are fire incidents reported in Morganville, NJ
Something went wrong! Please refresh the page.
|
| |||||||||||||||||||||||||||||||||||||||||||||||||||||||||||||||||||||||||||||||||||||||||||||||||||||||||||||
| Other | 33 | |||||||||||||||||||||||||||||||||||||||||||||||||||||||||||||||||||||||||||||||||||||||||||||||||||||||||||||
2003 - 2018 National Fire Incident Reporting System (NFIRS) incidents
- Incident types reported to NFIRS in Morganville, NJ
- 1,09546.9%Hazardous Condition
- 59325.4%Fire
- 42618.3%False Alarm
- 1285.5%Good Intent Call
- 441.9%Service Call
- 311.3%Rescue & EMS
- 60.3%Overpressure Rupture
- 60.3%Severe Weather
- 40.2%Special Incident
- Fire incident types reported to NFIRS in Morganville, NJ
- 18631.4%Outside Fires
- 18531.2%Other
- 15826.6%Structure Fires
- 6410.8%Mobile Property/Vehicle Fires
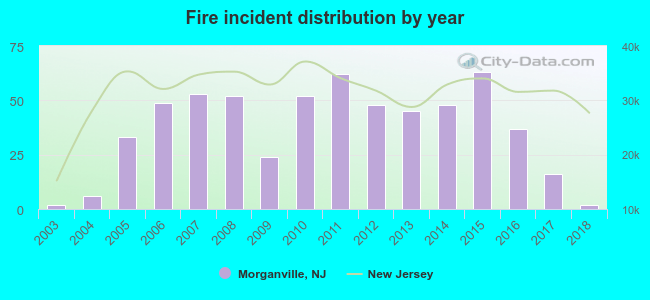 According to the data from the years 2003 - 2018 the average number of fire incidents per year is 37. The highest number of fire incidents - 63 took place in 2015, and the least - 2 in 2003. The data has a constant trend.
The average number of yearly fire incidents per 10k residents in Morganville, NJ compared to nearest cities:
(Note: Based on data for the last 3 years, including only cities with population 5,000 and above)
| Morganville: | 36.4 |
| Old Bridge: | 38.9 |
| Freehold: | 84.1 |
| Matawan: | 41.3 |
| Spotswood: | 16.0 |
| Jamesburg: | 16.6 |
| Keyport: | 58.2 |
| Laurence Harbor: | 5.4 |
| South River: | 15.5 |
 The median response time based on all reported fire incidents is 4 minutes. This is lower than the New Jersey median value.
The median response time in Morganville, NJ compared to nearest cities:
(Note: Based on data for all years, including only cities with at least 500 fire incidents)
| Morganville: | 4 minutes |
| Old Bridge: | 4 minutes |
| Freehold: | 5 minutes |
| Matawan: | 4 minutes |
| Keyport: | 4 minutes |
| East Brunswick: | 5 minutes |
| Sayreville: | 5 minutes |
| South Amboy: | 3 minutes |
| Tinton Falls: | 7 minutes |
 27.8% incidents where reported in the morning and 72.2% in the evening. The most fires (16.7%) took place on Thursday, and the least (12.5%) on Saturday.
 According to the 593 reports from years 2003 - 2018 most fires (13.0%) took place during April, and the least (4.6%) in October.
 Out of all 2,333 cases reported during the years 2003 - 2018, the most belonged to the categories: Hazardous Condition (46.9%), Fire (25.4%), and False Alarm (18.3%).
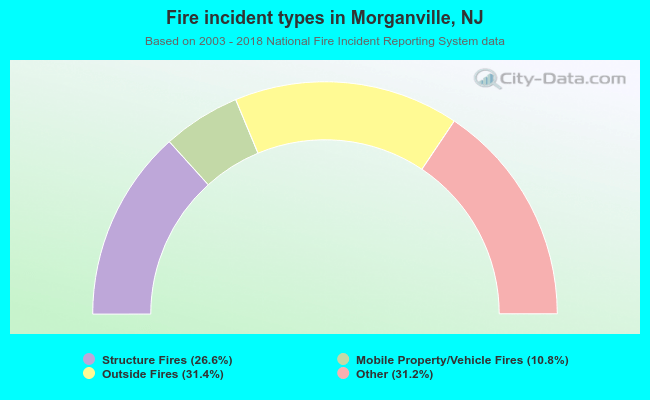 When looking into fire subcategories, the most reports belonged to: Outside Fires (31.4%), and Other (31.2%).