| Fire incidents reported |
|---|
| Sreet name | Count |
|---|
| 709 HANGING LIMB HWY | 8 | | EAST FORK LN | 6 | | VINES RIDGE RD | 6 | | WILDER HWY | 6 | | 107 MURPHY LN | 4 | | 1245 BUCK LN | 4 | | 135 TWINTON PARK RD | 4 | | 14488 PEACHSTONE LN | 4 | | 3261 WILDER HWY | 4 | | CRAVENSTOWN RD | 4 | | PEACHSTONE LN | 4 | | VINE RIDGE RD | 4 | | 102 BEAR KNOB LN | 2 | | 109 CRAVENSTOWN RD | 2 | | 109 GUFFEY LANE | 2 | | 110 BEATY LN | 2 | | 110 MILLER LN | 2 | | 1100 BLOCK HANGING LIMB HWY | 2 | | 115 EAST FORK LN | 2 | | 1200 VINE RIDGE RD | 2 | | 120RODGER NORROD LANE | 2 | | 121 WINDY MILL LANE | 2 | | 130 COMMUNITY CENTER RD | 2 | | 131 MILLER LANE | 2 | | 136 TWINTON PARK ROAD | 2 |
| | | Fire incidents reported |
|---|
| Sreet name | Count |
|---|
| 138 REED LN | 2 | | 141 MILLER LANE | 2 | | 14125 PEACHSTONE LN | 2 | | 142 CALICO LN | 2 | | 143 MURPHY LN | 2 | | 145 MILLER LN. | 2 | | 1504 HANGING LIMB HWY | 2 | | 1527 HANGING LIMB HWY | 2 | | 1528 HANGING LIMB HWY | 2 | | 153 SHILOTT RD | 2 | | 165 GEORGE RAMSEY LN | 2 | | 166 HANGING LIMB HWY | 2 | | 166 OLD BAKER LN | 2 | | 170 RYAN LN | 2 | | 1700 BLOCK EAST FORK RD | 2 | | 172 BOWMANLN | 2 | | 1721 HANGING LIMB HWY | 2 | | 176 BEATY LANE LANE | 2 | | 176 BEATY LN | 2 | | 178 COMMUNITY CENTER RD | 2 | | 178 OLD BAKER LN | 2 | | 179 BOWMAN LANE | 2 | | 185 LEMO GUFFEY LANE | 2 | | 1918 HANGING LIMB HWY | 2 | | 202 EAST FORK LN | 2 |
|
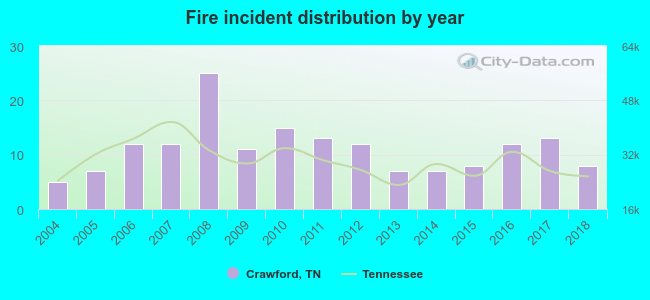 According to the data from the years 2004 - 2018 the average number of fire incidents per year is 11. The highest number of reported fires - 25 took place in 2008, and the least - 5 in 2004. The data has an increasing trend.
 28.7% incidents where reported in the morning and 71.3% in the evening. The most fires (19.2%) took place on Friday, and the least (9.6%) on Wednesday.
 According to the 167 reports from years 2004 - 2018 most fires (18.6%) took place during April, and the least (3.6%) in July.
 Out of all 381 cases reported during the years 2004 - 2018, the most belonged to the categories: Fire (43.8%), Rescue & EMS (25.5%), and Overpressure Rupture (23.9%).
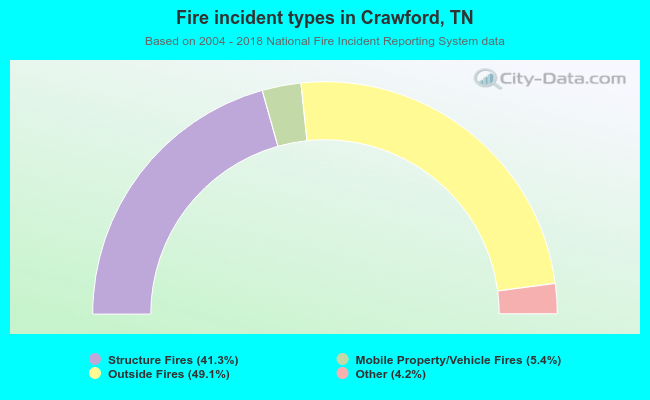 When looking into fire subcategories, the most incidents belonged to: Outside Fires (49.1%), and Structure Fires (41.3%).