Crosby: Fire Incidents, Texas (TX)
Where are fire incidents reported in Crosby, TX
Something went wrong! Please refresh the page.
| Fire incidents reported | |
|---|---|
| Sreet name | Count |
| FM 2100 | 300 |
| HWY 90 | 190 |
| FM 1942 | 164 |
| FM 2100 RD | 148 |
| SRALLA RD | 80 |
| RAMSEY RD | 74 |
| FOLEY RD | 70 |
| GULF PUMP RD | 70 |
| BOHEMIAN HALL RD | 68 |
| BEAUMONT HWY | 66 |
| KENNINGS RD | 64 |
| CROSBY FWY | 60 |
| CROSBY DAYTON RD | 56 |
| US 90 | 54 |
| FM 1942 RD | 52 |
| DIAMONDHEAD BLVD | 48 |
| GOLF CLUB DR | 48 |
| MILLER WILSON RD | 46 |
| KRENEK | 44 |
| HARVEY RD | 42 |
| MAIN ST | 42 |
| LORD RD | 40 |
| BARRETT RD | 38 |
| CROSBY EASTGATE RD | 38 |
| MAGNOLIA AVE | 38 |
| CROSBY DR | 36 |
| KRENEK RD | 34 |
| DAIRY OAKS RD | 32 |
| CHURCH ST | 30 |
| INDIAN SHORES RD | 30 |
| Other | 960 |
2004 - 2018 National Fire Incident Reporting System (NFIRS) incidents
- Incident types reported to NFIRS in Crosby, TX
- 3,06243.2%Fire
- 1,66023.4%Rescue & EMS
- 1,08015.2%Hazardous Condition
- 81111.4%Good Intent Call
- 3104.4%False Alarm
- 1532.2%Service Call
- 110.2%Special Incident
- Fire incident types reported to NFIRS in Crosby, TX
- 1,42246.4%Outside Fires
- 1,20239.3%Structure Fires
- 36411.9%Mobile Property/Vehicle Fires
- 742.4%Other
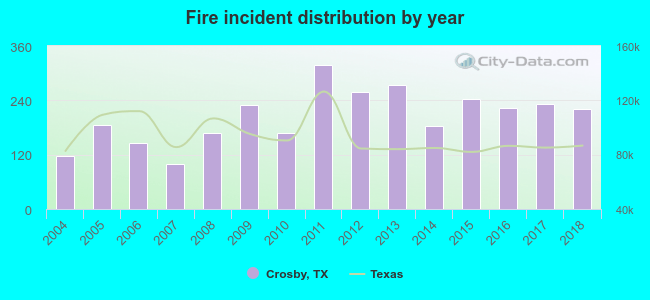 According to the data from the years 2004 - 2018 the average number of fires per year is 204. The highest number of reported fires - 319 took place in 2011, and the least - 100 in 2007. The data has a growing trend.
 The median response time based on all reported fire incidents is 11 minutes. This is higher compared to the state median value.
The median response time in Crosby, TX compared to nearest cities:
(Note: Based on data for all years, including only cities with at least 500 fire incidents)
| Crosby: | 11 minutes |
| Highlands: | 7 minutes |
| Channelview: | 7 minutes |
| Baytown: | 5 minutes |
| Humble: | 7 minutes |
| Dayton: | 8 minutes |
| Deer Park: | 5 minutes |
| La Porte: | 3 minutes |
| Pasadena: | 7 minutes |
 According to the data from the years 2004 - 2018 the average number of fire-related yearly deaths is 0. The highest number of deaths - 1 took place in 2006, and the lowest - 0 in 2004. The data has a constant trend.
The average number of deaths per 1,000 fire incidents is 2. This indicator was the highest - 7 in 2006, and the lowest 0 in 2004. The trend for fatalities per 1,000 incidents is constant. Compared to the state value the number of deaths per 1,000 fires is about the same.
According to the data from the years 2004 - 2018 the average number of fire-related yearly deaths is 0. The highest number of deaths - 1 took place in 2006, and the lowest - 0 in 2004. The data has a constant trend.
The average number of deaths per 1,000 fire incidents is 2. This indicator was the highest - 7 in 2006, and the lowest 0 in 2004. The trend for fatalities per 1,000 incidents is constant. Compared to the state value the number of deaths per 1,000 fires is about the same.
 According to the reports from the years 2004 - 2018 the average number of fire-related yearly casualties is 1. The highest number of reported casualties - 10 took place in 2016, and the lowest - 0 in 2005. The data has a constant trend.
The average number of casualties per 1,000 fire incidents is 7. This indicator was the highest - 45 in 2016, and the lowest 0 in 2005. The trend for casualties per 1,000 incidents is dropping. Compared to the Texas value the number of injuries per 1,000 incidents is similar.
According to the reports from the years 2004 - 2018 the average number of fire-related yearly casualties is 1. The highest number of reported casualties - 10 took place in 2016, and the lowest - 0 in 2005. The data has a constant trend.
The average number of casualties per 1,000 fire incidents is 7. This indicator was the highest - 45 in 2016, and the lowest 0 in 2005. The trend for casualties per 1,000 incidents is dropping. Compared to the Texas value the number of injuries per 1,000 incidents is similar.
 30.6% incidents where reported in the morning and 69.4% in the evening. The most fires (15.9%) took place on Saturday, and the least (13.1%) on Friday.
 According to the 3,062 incident reports from years 2004 - 2018 most fires (11.1%) took place during January, and the least (6.7%) in February.
 Out of all 7,095 cases reported during the years 2004 - 2018, the most belonged to the categories: Fire (43.2%), Rescue & EMS (23.4%), and Hazardous Condition (15.2%).
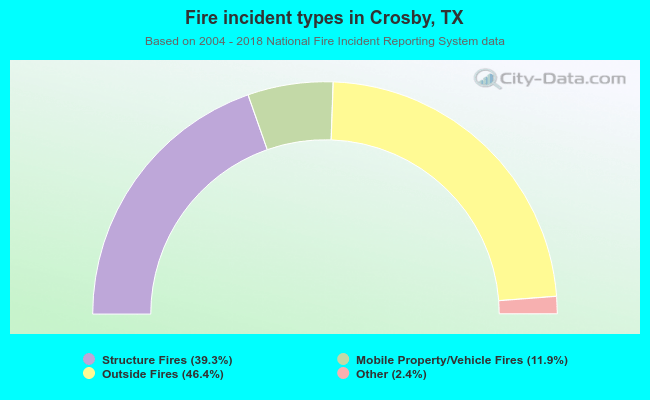 When looking into fire subcategories, the most reports belonged to: Outside Fires (46.4%), and Structure Fires (39.3%).