La Porte: Fire Incidents, Texas (TX)
Where are fire incidents reported in La Porte, TX
Something went wrong! Please refresh the page.
| Fire incidents reported | |
|---|---|
| Sreet name | Count |
| HIGHWAY 146 | 196 |
| HIGHWAY 225 | 152 |
| SPENCER HWY | 130 |
| BROADWAY | 112 |
| BAYSHORE DR | 96 |
| SENS RD | 74 |
| FAIRMONT (8200 - 12000) PKY | 60 |
| UNDERWOOD RD | 58 |
| P ST | 56 |
| MAIN ST | 54 |
| SECOND ST | 52 |
| LUELLA BLVD | 46 |
| FAIRMONT (100 - 1800) PKY | 36 |
| FAIRMONT PKY | 32 |
| L (LOMAX) ST | 32 |
| H ST | 30 |
| STRANG RD | 30 |
| TENTH ST | 30 |
| BAY OAKS DR | 28 |
| RUSTIC GATES RD | 28 |
| SIXTH ST | 28 |
| EIGHTH ST | 24 |
| FAIRMONT8200 12000 PKY | 24 |
| BAY AREA BLVD | 22 |
| FAIRMONT PARKWAY ST | 22 |
| MILLER CUT-OFF RD | 22 |
| SCOTCH MOSS LANE | 22 |
| THIRD ST | 22 |
| BARBOUR'S CUT BLVD | 20 |
| BARBOURS CUT BLVD | 20 |
| Other | 104 |
2004 - 2018 National Fire Incident Reporting System (NFIRS) incidents
- Incident types reported to NFIRS in La Porte, TX
- 2,23928.9%Rescue & EMS
- 2,02526.1%Hazardous Condition
- 1,66221.4%Fire
- 99012.8%False Alarm
- 5567.2%Good Intent Call
- 2353.0%Service Call
- 220.3%Special Incident
- 170.2%Overpressure Rupture
- Fire incident types reported to NFIRS in La Porte, TX
- 73144.0%Outside Fires
- 40124.1%Structure Fires
- 34820.9%Mobile Property/Vehicle Fires
- 18211.0%Other
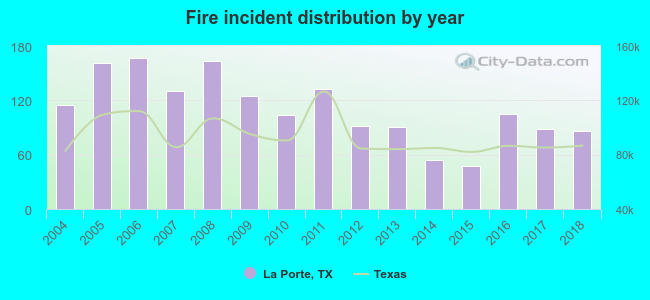 According to the data from the years 2004 - 2018 the average number of fires per year is 111. The highest number of reported fire incidents - 167 took place in 2006, and the least - 48 in 2015. The data has a dropping trend.
The average number of yearly fire incidents per 10k residents in La Porte, TX compared to nearest cities:
(Note: Based on data for the last 3 years, including only cities with population 5,000 and above)
| La Porte: | 26.5 |
| Deer Park: | 13.1 |
| Seabrook: | 13.6 |
| Baytown: | 41.1 |
| Pasadena: | 10.7 |
| Channelview: | 55.4 |
| Webster: | 63.6 |
| Highlands: | 192.3 |
| South Houston: | 1.1 |
 The median response time based on all reported fire incidents is 3 minutes. This is much lower compared to the Texas median value.
The median response time in La Porte, TX compared to nearest cities:
(Note: Based on data for all years, including only cities with at least 500 fire incidents)
| La Porte: | 3 minutes |
| Deer Park: | 5 minutes |
| Seabrook: | 8 minutes |
| Baytown: | 5 minutes |
| Pasadena: | 7 minutes |
| Channelview: | 7 minutes |
| Webster: | 5 minutes |
| Highlands: | 7 minutes |
| League City: | 7 minutes |
 31.5% incidents where reported in the morning and 68.5% in the evening. The most fires (16.4%) took place on Monday, and the least (12.2%) on Wednesday.
 According to the 1,662 fire incidents from years 2004 - 2018 most fires (10.5%) took place during June, and the least (6.1%) in August.
 Out of all 7,753 cases reported during the years 2004 - 2018, the most belonged to the categories: Rescue & EMS (28.9%), Hazardous Condition (26.1%), and Fire (21.4%).
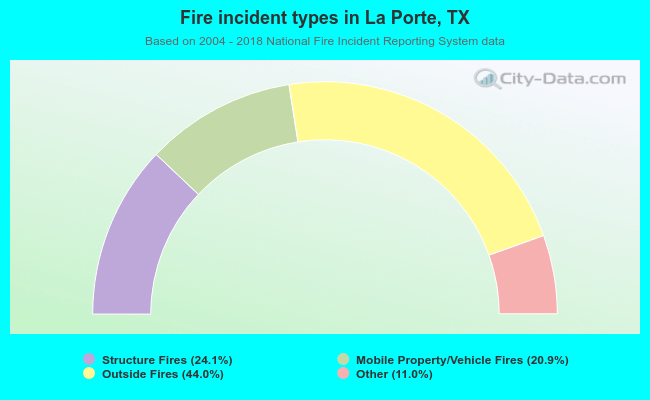 When looking into fire subcategories, the most reports belonged to: Outside Fires (44.0%), and Structure Fires (24.1%).