Croydon: Fire Incidents, Pennsylvania (PA)
Where are fire incidents reported in Croydon, PA
Something went wrong! Please refresh the page.
|
| |||||||||||||||||||||||||||||||||||||||||||||||||||||||||||||||||||||||||||||||||||||||||||||||||||||||||||||
2003 - 2018 National Fire Incident Reporting System (NFIRS) incidents
- Incident types reported to NFIRS in Croydon, PA
- 55953.4%Fire
- 23922.8%Hazardous Condition
- 1009.6%Rescue & EMS
- 737.0%False Alarm
- 363.4%Good Intent Call
- 333.2%Service Call
- 40.4%Special Incident
- Fire incident types reported to NFIRS in Croydon, PA
- 36565.3%Structure Fires
- 12822.9%Outside Fires
- 397.0%Mobile Property/Vehicle Fires
- 274.8%Other
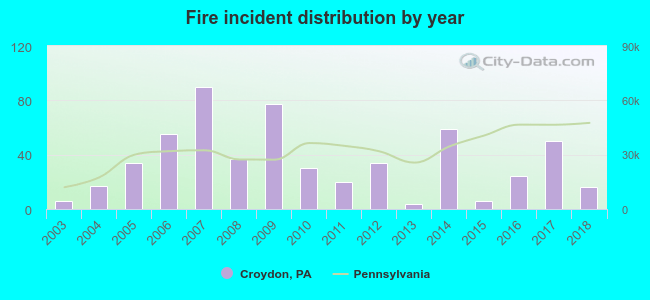 Based on the data from the years 2003 - 2018 the average number of fires per year is 35. The highest number of fire incidents - 90 took place in 2007, and the least - 4 in 2013. The data has a rising trend.
The average number of yearly fire incidents per 10k residents in Croydon, PA compared to nearest cities:
(Note: Based on data for the last 3 years, including only cities with population 5,000 and above)
| Croydon: | 30.2 |
| Bristol: | 101.1 |
| Levittown: | 47.2 |
| Fairless Hills: | 46.9 |
| Morrisville: | 86.5 |
| Richboro: | 9.1 |
| Willow Grove: | 12.9 |
| Hatboro: | 25.1 |
| Glenside: | 70.8 |
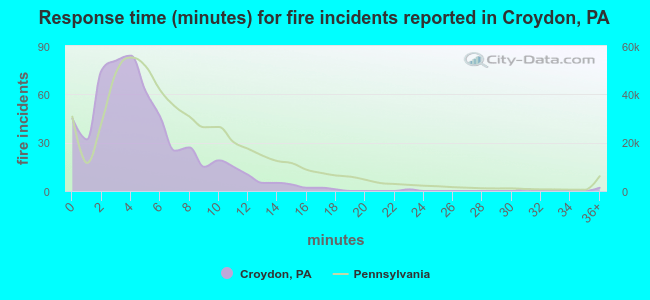 The median response time based on all reported fire incidents is 4 minutes. This is lower than the Pennsylvania median value.
The median response time in Croydon, PA compared to nearest cities:
(Note: Based on data for all years, including only cities with at least 500 fire incidents)
| Croydon: | 4 minutes |
| Bristol: | 5 minutes |
| Levittown: | 5 minutes |
| Florence: | 8 minutes |
| Langhorne: | 5 minutes |
| Palmyra: | 4 minutes |
| Morrisville: | 6 minutes |
| Bordentown: | 7 minutes |
| Trenton: | 4 minutes |
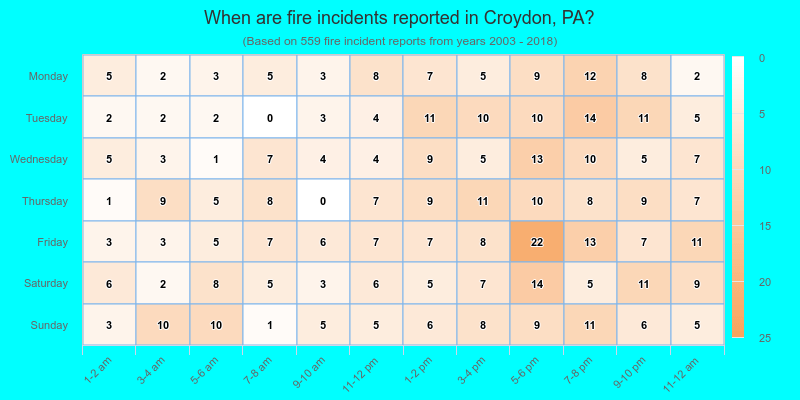
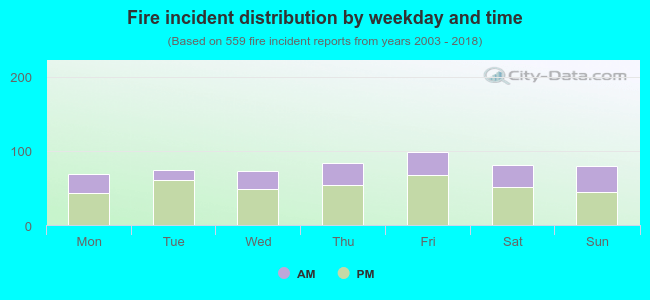 33.6% incidents where reported in the morning and 66.4% in the evening. The most fires (17.7%) took place on Friday, and the least (12.3%) on Monday.
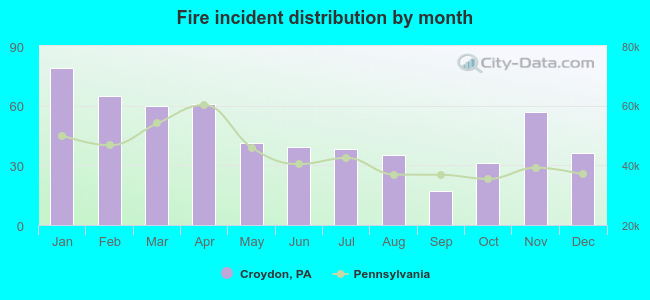 According to the 559 reports from years 2003 - 2018 most fires (14.1%) took place during January, and the least (3.0%) in September.
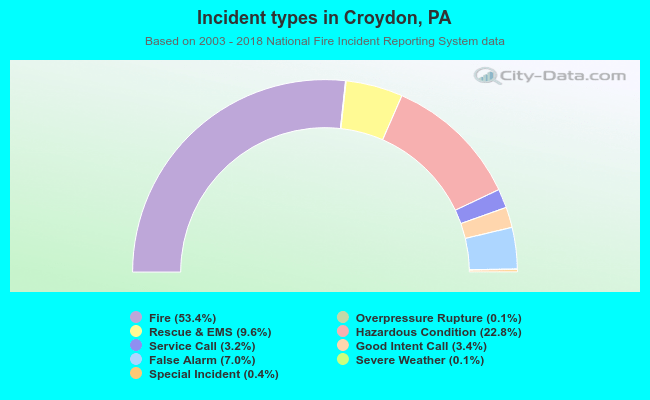 Out of all 1,046 cases reported during the years 2003 - 2018, the most belonged to the categories: Fire (53.4%), Hazardous Condition (22.8%), and Rescue & EMS (9.6%).
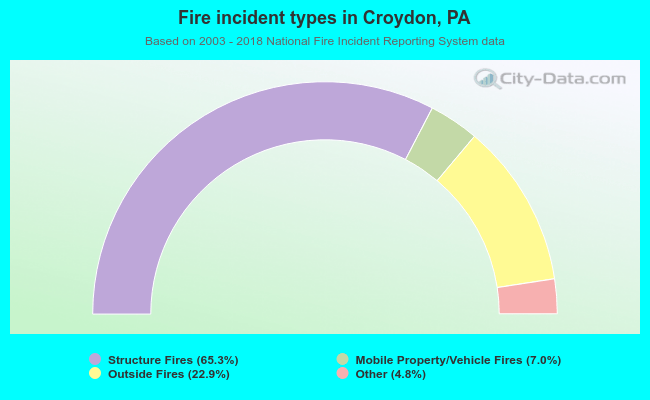 When looking into fire subcategories, the most reports belonged to: Structure Fires (65.3%), and Outside Fires (22.9%).