Hatboro: Fire Incidents, Pennsylvania (PA)
Where are fire incidents reported in Hatboro, PA
Something went wrong! Please refresh the page.
|
| |||||||||||||||||||||||||||||||||||||||||||||||||||||||||||||||||||||||||||||||||||||||||||||||||||||||||||||
2004 - 2018 National Fire Incident Reporting System (NFIRS) incidents
- Incident types reported to NFIRS in Hatboro, PA
- 20624.3%Fire
- 20424.0%Hazardous Condition
- 14417.0%False Alarm
- 11713.8%Good Intent Call
- 9911.7%Rescue & EMS
- 596.9%Service Call
- 192.2%Special Incident
- 10.1%Overpressure Rupture
- Fire incident types reported to NFIRS in Hatboro, PA
- 13565.5%Structure Fires
- 4421.4%Outside Fires
- 178.3%Mobile Property/Vehicle Fires
- 104.9%Other
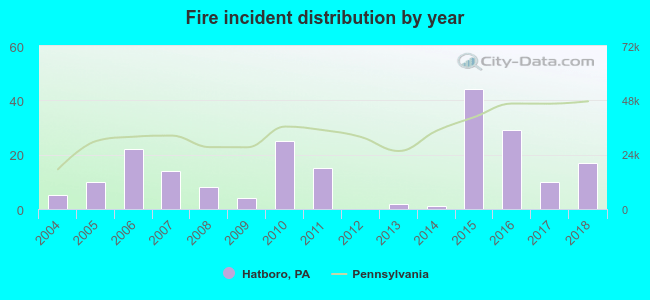 Based on the data from the years 2004 - 2018 the average number of fires per year is 14. The highest number of fire incidents - 44 took place in 2015, and the least - 0 in 2012. The data has a growing trend.
The average number of yearly fire incidents per 10k residents in Hatboro, PA compared to nearest cities:
(Note: Based on data for the last 3 years, including only cities with population 5,000 and above)
| Hatboro: | 25.1 |
| Horsham: | 23.8 |
| Willow Grove: | 12.9 |
| Maple Glen: | 3.0 |
| Fort Washington: | 36.1 |
| Glenside: | 70.8 |
| Oreland: | 24.7 |
| Richboro: | 9.1 |
| Ambler: | 37.4 |
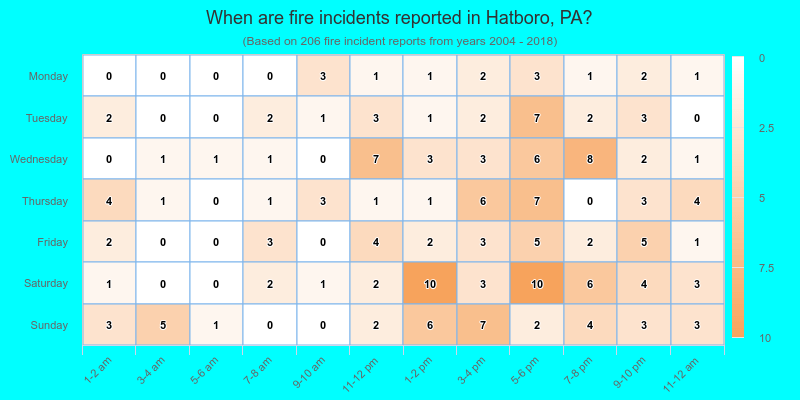
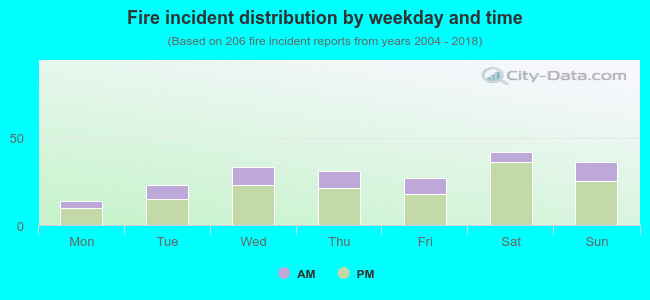 28.2% incidents where reported in the morning and 71.8% in the evening. The most fires (20.4%) took place on Saturday, and the least (6.8%) on Monday.
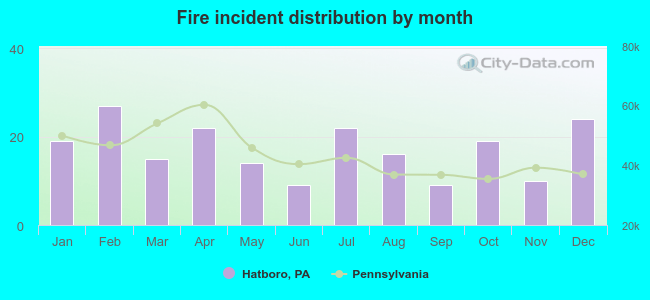 According to the 206 fire incidents from years 2004 - 2018 most fires (13.1%) took place during February, and the least (4.4%) in June.
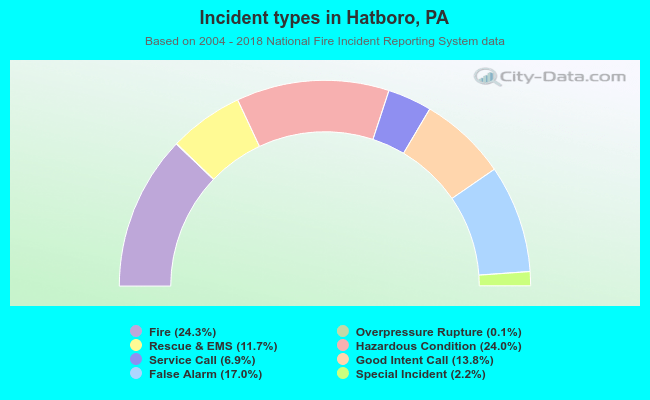 Out of all 849 cases reported during the years 2004 - 2018, the most belonged to the categories: Fire (24.3%), Hazardous Condition (24.0%), and False Alarm (17.0%).
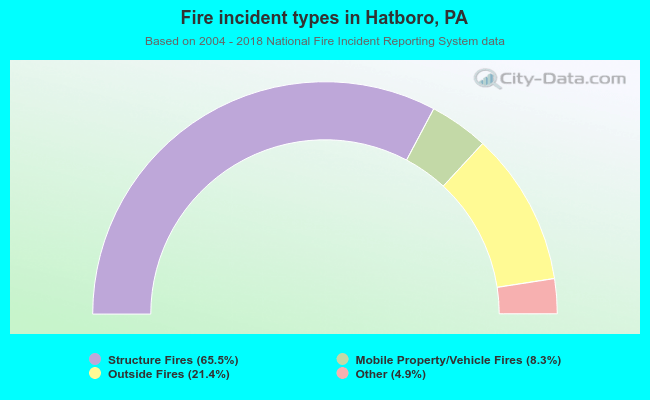 When looking into fire subcategories, the most incidents belonged to: Structure Fires (65.5%), and Outside Fires (21.4%).