Cumberland: Fire Incidents, Rhode Island (RI)
Where are fire incidents reported in Cumberland, RI
Something went wrong! Please refresh the page.
| Fire incidents reported | |
|---|---|
| Sreet name | Count |
| MENDON RD | 316 |
| DIAMOND HILL RD | 96 |
| BROAD ST | 78 |
| MANVILLE HILL RD | 50 |
| HIGH ST | 48 |
| FLAT ST | 40 |
| NATE WHIPPLE HWY | 34 |
| BEAR HILL RD | 32 |
| MARTIN ST | 26 |
| WRENTHAM RD | 26 |
| TITUS ST | 24 |
| JOHN ST | 22 |
| WOODWARD ST | 22 |
| RESERVOIR RD | 20 |
| ABBOTT ST | 18 |
| SCOTT RD | 18 |
| ABBOTT RUN VALLEY RD | 16 |
| HEROUX BLVD | 16 |
| HIGHLAND CORPORATE DR | 16 |
| MILL ST | 16 |
| POUND RD | 16 |
| BURNT SWAMP RD | 14 |
| PINE SWAMP RD | 14 |
| ROUTE 295 | 14 |
| TOWER HILL RD | 14 |
| ANGELL RD | 12 |
| CLARK ST | 12 |
| HIGHLAND AVE | 12 |
| HINES RD | 12 |
| PLANT ST | 12 |
2004 - 2018 National Fire Incident Reporting System (NFIRS) incidents
- Incident types reported to NFIRS in Cumberland, RI
- 11,32064.2%Rescue & EMS
- 1,90310.8%False Alarm
- 1,4428.2%Service Call
- 1,0616.0%Hazardous Condition
- 1,0506.0%Fire
- 7684.4%Good Intent Call
- 310.2%Overpressure Rupture
- 230.1%Severe Weather
- 230.1%Special Incident
- Fire incident types reported to NFIRS in Cumberland, RI
- 56253.5%Structure Fires
- 30228.8%Outside Fires
- 11811.2%Mobile Property/Vehicle Fires
- 686.5%Other
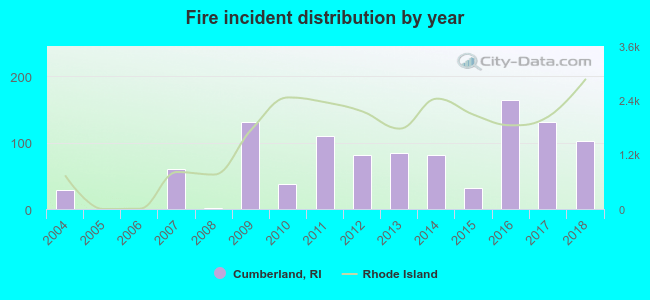 Based on the data from the years 2004 - 2018 the average number of fire incidents per year is 70. The highest number of fires - 164 took place in 2016, and the least - 0 in 2005. The data has a rising trend.
The average number of yearly fire incidents per 10k residents in Cumberland, RI compared to nearest cities:
(Note: Based on data for the last 3 years, including only cities with population 5,000 and above)
| Cumberland: | 39.7 |
| Lincoln: | 31.0 |
| Central Falls: | 96.2 |
| Pawtucket: | 0.3 |
| Woonsocket: | 50.6 |
| North Smithfield: | 12.0 |
| Smithfield: | 27.7 |
| Providence: | 4.8 |
| Johnston: | 26.6 |
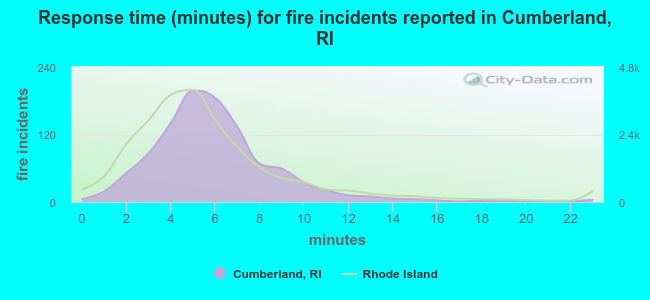 The median response time based on all reported fire incidents is 6 minutes. This is about the same as the state median value.
The median response time in Cumberland, RI compared to nearest cities:
(Note: Based on data for all years, including only cities with at least 500 fire incidents)
| Cumberland: | 6 minutes |
| Lincoln: | 4 minutes |
| Central Falls: | 2 minutes |
| Attleboro: | 4 minutes |
| Woonsocket: | 5 minutes |
| Plainville: | 4 minutes |
| North Providence: | 4 minutes |
| Smithfield: | 6 minutes |
| Blackstone: | 5 minutes |
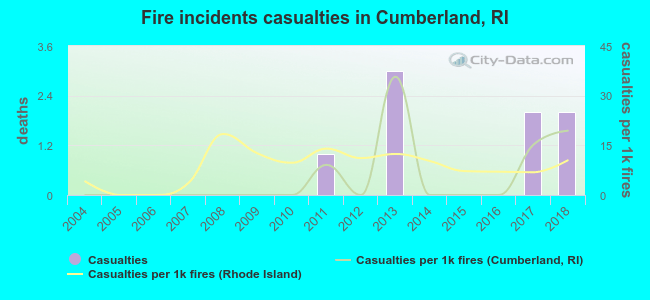 According to the reports from the years 2004 - 2018 the average number of fire-related yearly casualties is 1. The highest number of injuries - 3 took place in 2013, and the lowest - 0 in 2004. The data has a growing trend.
The average number of injuries per 1,000 fire incidents is 5. This indicator was the highest - 36 in 2013, and the lowest 0 in 2004. The trend for injuries per 1,000 incidents is rising. Compared to the state value the number of injuries per 1,000 incidents is lower.
According to the reports from the years 2004 - 2018 the average number of fire-related yearly casualties is 1. The highest number of injuries - 3 took place in 2013, and the lowest - 0 in 2004. The data has a growing trend.
The average number of injuries per 1,000 fire incidents is 5. This indicator was the highest - 36 in 2013, and the lowest 0 in 2004. The trend for injuries per 1,000 incidents is rising. Compared to the state value the number of injuries per 1,000 incidents is lower.Casualties per 1,000 incidents in Cumberland, RI compared to nearest cities:
(Note: Based on data for all years, including only cities with at least 500 fire incidents)
| Cumberland: | 7.6 |
| Lincoln: | 6.0 |
| Central Falls: | 11.8 |
| Attleboro: | 9.0 |
| Woonsocket: | 9.9 |
| Plainville: | 7.6 |
| North Providence: | 10.6 |
| Smithfield: | 6.1 |
| Blackstone: | 15.5 |
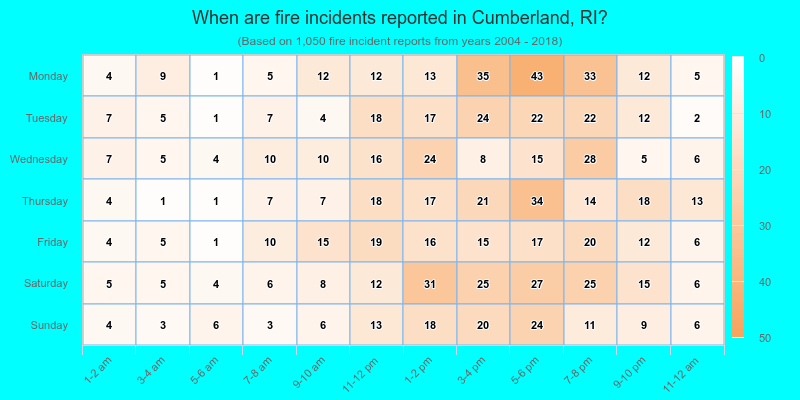
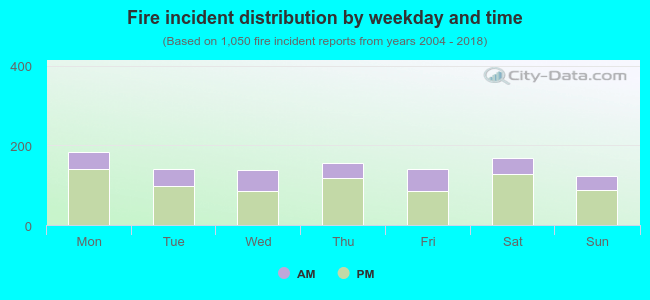 29.0% incidents where reported in the morning and 71.0% in the evening. The most fires (17.5%) took place on Monday, and the least (11.7%) on Sunday.
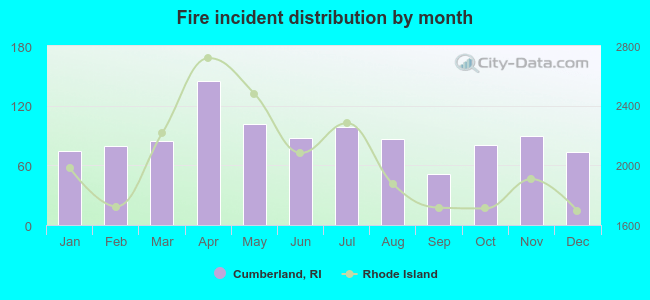 Based on the 1,050 reports from years 2004 - 2018 most fires (13.8%) took place during April, and the least (4.9%) in September.
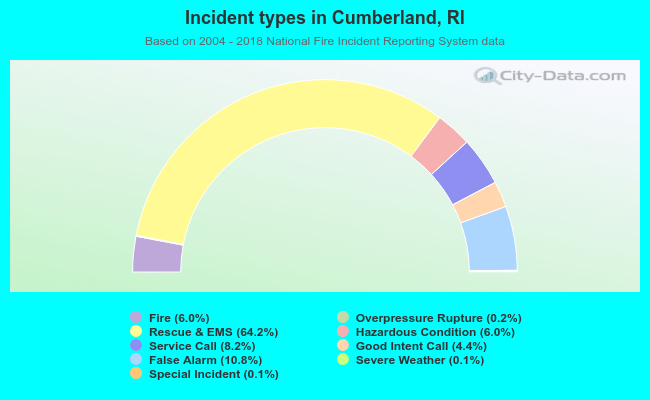 Out of all 17,621 cases reported during the years 2004 - 2018, the most belonged to the categories: Rescue & EMS (64.2%), False Alarm (10.8%), and Service Call (8.2%).
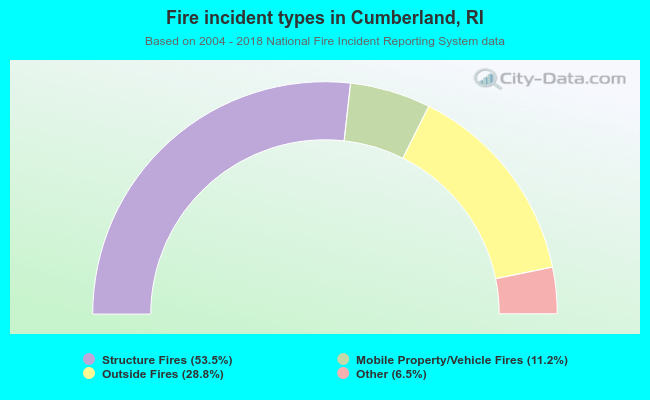 When looking into fire subcategories, the most reports belonged to: Structure Fires (53.5%), and Outside Fires (28.8%).