Dagsboro: Fire Incidents, Delaware (DE)
Where are fire incidents reported in Dagsboro, DE
Something went wrong! Please refresh the page.
|
| |||||||||||||||||||||||||||||||||||||||||||||||||||||||||||||||||||||||||||||||||||||||||||||||||||||||||||||
| Other | 19 | |||||||||||||||||||||||||||||||||||||||||||||||||||||||||||||||||||||||||||||||||||||||||||||||||||||||||||||
2002 - 2018 National Fire Incident Reporting System (NFIRS) incidents
- Incident types reported to NFIRS in Dagsboro, DE
- 59134.3%Fire
- 42524.7%Rescue & EMS
- 38922.6%Hazardous Condition
- 1347.8%False Alarm
- 975.6%Service Call
- 824.8%Good Intent Call
- 30.2%Overpressure Rupture
- Fire incident types reported to NFIRS in Dagsboro, DE
- 29249.4%Structure Fires
- 22237.6%Outside Fires
- 498.3%Mobile Property/Vehicle Fires
- 284.7%Other
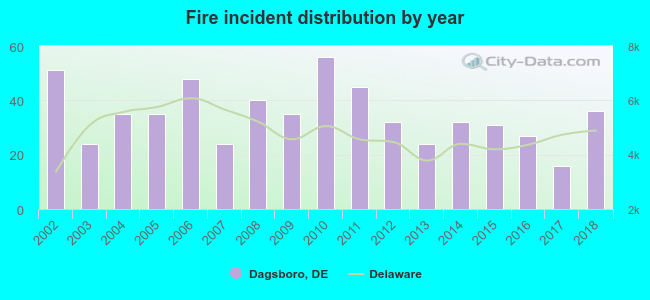 According to the data from the years 2002 - 2018 the average number of fires per year is 35. The highest number of reported fire incidents - 56 took place in 2010, and the least - 16 in 2017. The data has a decreasing trend.
 The median response time based on all reported fire incidents is 9 minutes. This is higher compared to the state median value.
The median response time in Dagsboro, DE compared to nearest cities:
(Note: Based on data for all years, including only cities with at least 500 fire incidents)
| Dagsboro: | 9 minutes |
| Frankford: | 8 minutes |
| Millsboro: | 9 minutes |
| Bethany Beach: | 7 minutes |
| Georgetown: | 9 minutes |
| Rehoboth Beach: | 6 minutes |
| Lewes: | 8 minutes |
| Laurel: | 10 minutes |
| Delmar: | 9 minutes |
 25.7% incidents where reported in the morning and 74.3% in the evening. The most fires (18.3%) took place on Friday, and the least (11.8%) on Tuesday.
 Based on the 591 incident reports from years 2002 - 2018 most fires (14.2%) took place during April, and the least (3.6%) in October.
 Out of all 1,722 cases reported during the years 2002 - 2018, the most belonged to the categories: Fire (34.3%), Rescue & EMS (24.7%), and Hazardous Condition (22.6%).
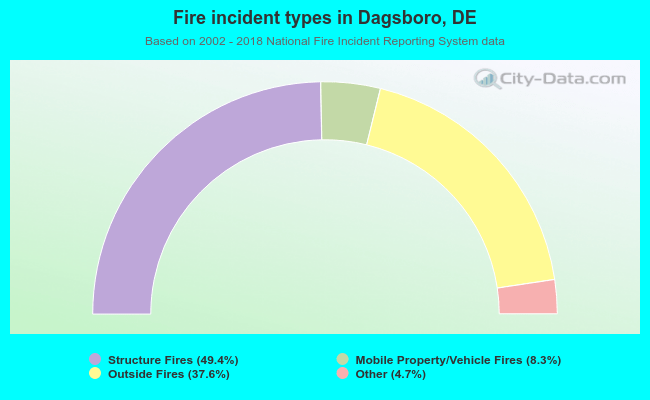 When looking into fire subcategories, the most incidents belonged to: Structure Fires (49.4%), and Outside Fires (37.6%).