Millsboro: Fire Incidents, Delaware (DE)
Where are fire incidents reported in Millsboro, DE
Something went wrong! Please refresh the page.
|
| |||||||||||||||||||||||||||||||||||||||||||||||||||||||||||||||||||||||||||||||||||||||||||||||||||||||||||||
| Other | 1,271 | |||||||||||||||||||||||||||||||||||||||||||||||||||||||||||||||||||||||||||||||||||||||||||||||||||||||||||||
2002 - 2018 National Fire Incident Reporting System (NFIRS) incidents
- Incident types reported to NFIRS in Millsboro, DE
- 2,06330.1%Fire
- 1,85627.1%Rescue & EMS
- 1,18217.3%Hazardous Condition
- 73410.7%Good Intent Call
- 5257.7%False Alarm
- 4296.3%Service Call
- 230.3%Severe Weather
- 230.3%Special Incident
- 100.1%Overpressure Rupture
- Fire incident types reported to NFIRS in Millsboro, DE
- 85341.3%Structure Fires
- 77337.5%Outside Fires
- 27213.2%Mobile Property/Vehicle Fires
- 1658.0%Other
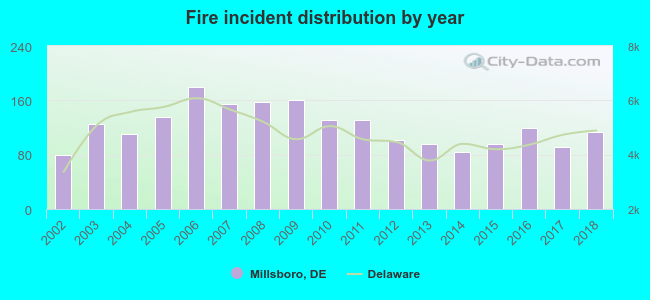 Based on the data from the years 2002 - 2018 the average number of fires per year is 121. The highest number of fires - 179 took place in 2006, and the least - 79 in 2002. The data has a rising trend.
 The median response time based on all reported fire incidents is 9 minutes. This is higher than the Delaware median value.
The median response time in Millsboro, DE compared to nearest cities:
(Note: Based on data for all years, including only cities with at least 500 fire incidents)
| Millsboro: | 9 minutes |
| Dagsboro: | 9 minutes |
| Frankford: | 8 minutes |
| Georgetown: | 9 minutes |
| Bethany Beach: | 7 minutes |
| Rehoboth Beach: | 6 minutes |
| Lewes: | 8 minutes |
| Laurel: | 10 minutes |
| Delmar: | 9 minutes |
 30.4% incidents where reported in the morning and 69.6% in the evening. The most fires (15.3%) took place on Friday, and the least (13.7%) on Sunday.
 According to the 2,063 fire incident reports from years 2002 - 2018 most fires (12.7%) took place during April, and the least (6.2%) in October.
 Out of all 6,845 cases reported during the years 2002 - 2018, the most belonged to the categories: Fire (30.1%), Rescue & EMS (27.1%), and Hazardous Condition (17.3%).
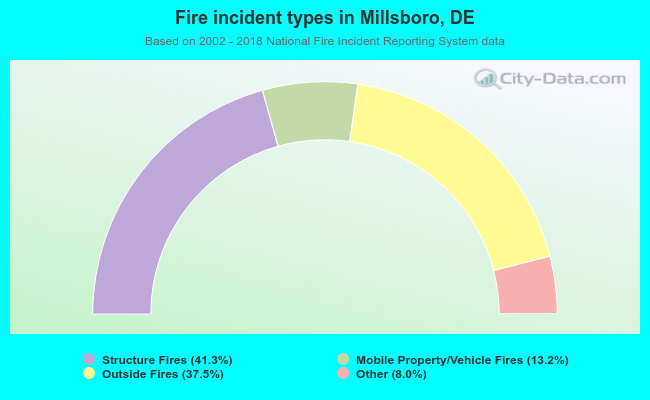 When looking into fire subcategories, the most incidents belonged to: Structure Fires (41.3%), and Outside Fires (37.5%).