Dale: Fire Incidents, Indiana (IN)
Where are fire incidents reported in Dale, IN
Something went wrong! Please refresh the page.
|
| |||||||||||||||||||||||||||||||||||||||||||||||||||||||||||||||||||||||||||||||||||||||||||||||||||||||||||||
2002 - 2018 National Fire Incident Reporting System (NFIRS) incidents
- Incident types reported to NFIRS in Dale, IN
- 43543.8%Rescue & EMS
- 20720.8%Fire
- 20520.6%Good Intent Call
- 636.3%Hazardous Condition
- 606.0%False Alarm
- 212.1%Service Call
- 20.2%Special Incident
- 10.1%Severe Weather
- Fire incident types reported to NFIRS in Dale, IN
- 9545.9%Structure Fires
- 6531.4%Outside Fires
- 3818.4%Mobile Property/Vehicle Fires
- 94.3%Other
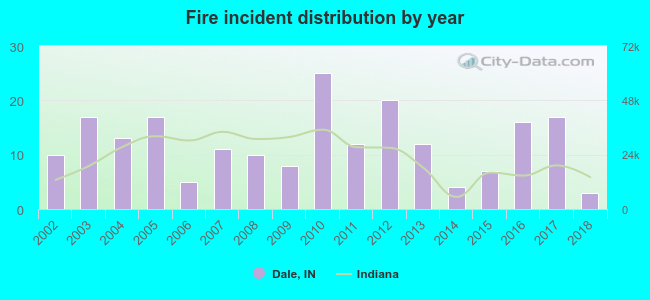 Based on the data from the years 2002 - 2018 the average number of fire incidents per year is 12. The highest number of reported fire incidents - 25 took place in 2010, and the least - 3 in 2018. The data has a decreasing trend.
 33.3% incidents where reported in the morning and 66.7% in the evening. The most fires (18.8%) took place on Saturday, and the least (9.7%) on Tuesday.
 Based on the 207 fires from years 2002 - 2018 most fires (13.0%) took place during October, and the least (4.8%) in August.
 Out of all 994 cases reported during the years 2002 - 2018, the most belonged to the categories: Overpressure Rupture (43.8%), Fire (20.8%), and Service Call (20.6%).
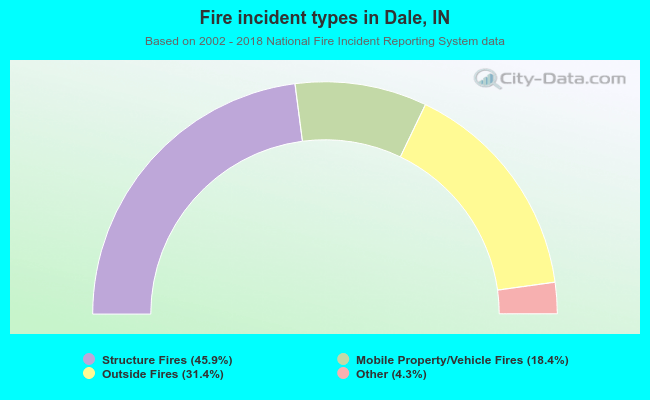 When looking into fire subcategories, the most incidents belonged to: Structure Fires (45.9%), and Outside Fires (31.4%).