De Soto: Fire Incidents, Kansas (KS)
Where are fire incidents reported in De Soto, KS
Something went wrong! Please refresh the page.
|
| |||||||||||||||||||||||||||||||||||||||||||||||||||||||||||||||||||||||||||||||||||||||||||||||||||||||||||||
2002 - 2018 National Fire Incident Reporting System (NFIRS) incidents
- Incident types reported to NFIRS in De Soto, KS
- 1,10452.7%Rescue & EMS
- 28113.4%Good Intent Call
- 26412.6%Fire
- 1939.2%Hazardous Condition
- 1306.2%Service Call
- 1145.4%False Alarm
- 30.1%Severe Weather
- 30.1%Special Incident
- Fire incident types reported to NFIRS in De Soto, KS
- 15358.0%Outside Fires
- 5621.2%Structure Fires
- 5420.5%Mobile Property/Vehicle Fires
- 10.4%Other
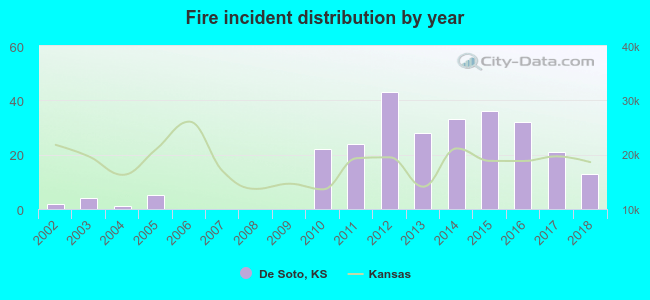 According to the data from the years 2002 - 2018 the average number of fires per year is 16. The highest number of fire incidents - 43 took place in 2012, and the least - 0 in 2006. The data has a rising trend.
The average number of yearly fire incidents per 10k residents in De Soto, KS compared to nearest cities:
(Note: Based on data for the last 3 years, including only cities with population 5,000 and above)
| De Soto: | 36.4 |
| Eudora: | 108.4 |
| Bonner Springs: | 50.3 |
| Olathe: | 21.1 |
| Gardner: | 33.9 |
| Lenexa: | 30.4 |
| Shawnee: | 23.6 |
| Tonganoxie: | 213.8 |
| Basehor: | 108.7 |
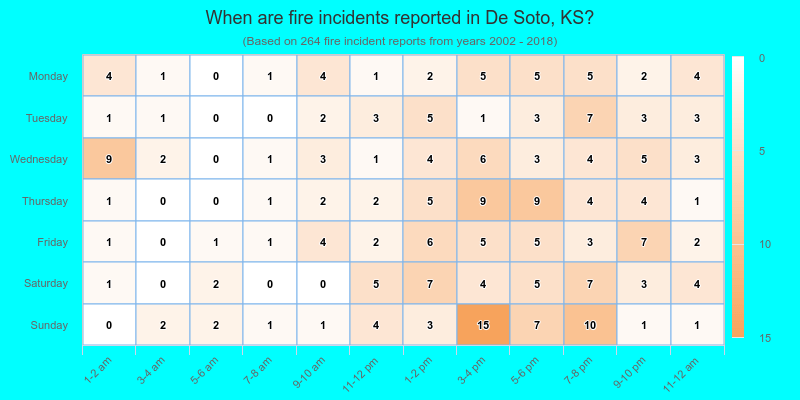
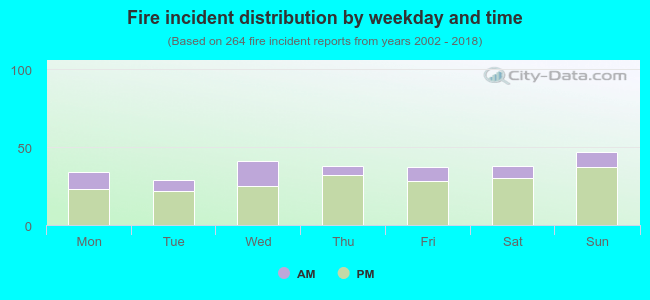 25.4% incidents where reported in the morning and 74.6% in the evening. The most fires (17.8%) took place on Sunday, and the least (11.0%) on Tuesday.
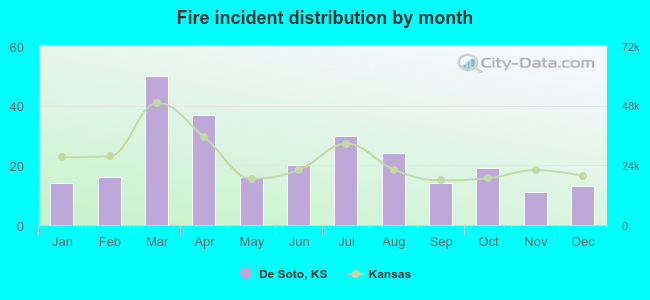 Based on the 264 reports from years 2002 - 2018 most fires (18.9%) took place during March, and the least (4.2%) in November.
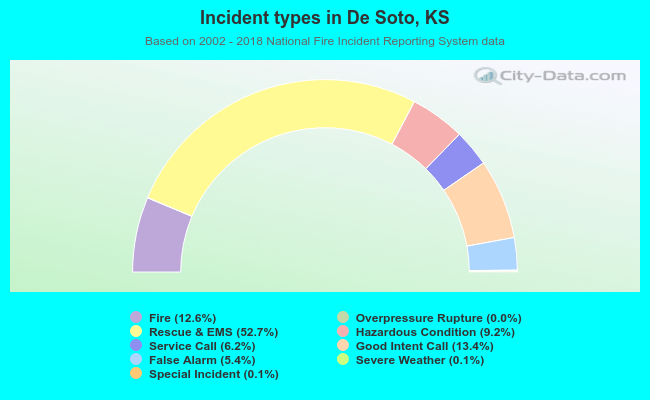 Out of all 2,093 cases reported during the years 2002 - 2018, the most belonged to the categories: Rescue & EMS (52.7%), Good Intent Call (13.4%), and Fire (12.6%).
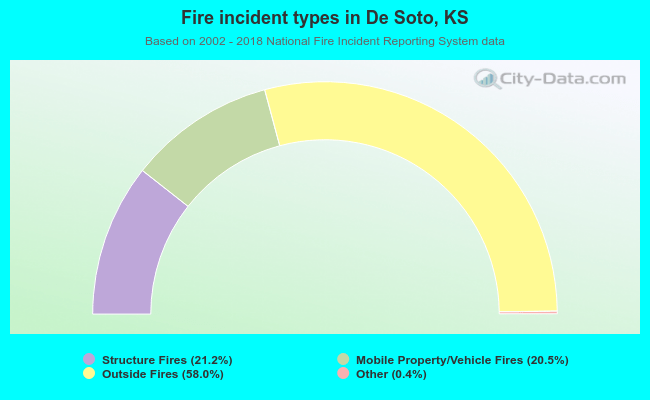 When looking into fire subcategories, the most reports belonged to: Outside Fires (58.0%), and Structure Fires (21.2%).