Shawnee: Fire Incidents, Kansas (KS)
Where are fire incidents reported in Shawnee, KS
Something went wrong! Please refresh the page.
| Fire incidents reported | |
|---|---|
| Sreet name | Count |
| SHAWNEE MISSION PKY | 254 |
| JOHNSON DR | 116 |
| 75TH ST | 112 |
| 65TH ST | 94 |
| MIDLAND DR | 84 |
| 67TH ST | 72 |
| FLINT | 66 |
| 66TH ST | 62 |
| HEDGE LANE TER | 62 |
| LACKMAN RD | 62 |
| 71ST ST | 54 |
| GODDARD ST | 54 |
| 76TH TER | 52 |
| FLINT ST | 52 |
| 75TH TER | 46 |
| 70TH ST | 44 |
| 66TH TER | 42 |
| HOLLIDAY DR | 42 |
| NIEMAN | 42 |
| WOODLAND | 42 |
| LACKMAN | 40 |
| RENNER | 40 |
| NIEMAN RD | 38 |
| OASIS CT | 38 |
| 70TH TER | 36 |
| 77TH ST | 36 |
| I-435 | 36 |
| 43RD ST | 34 |
| 47TH ST | 34 |
| 55TH ST | 34 |
| Other | 495 |
2002 - 2018 National Fire Incident Reporting System (NFIRS) incidents
- Incident types reported to NFIRS in Shawnee, KS
- 15,40055.0%Rescue & EMS
- 3,19911.4%Good Intent Call
- 2,6339.4%Hazardous Condition
- 2,3518.4%Service Call
- 2,3158.3%Fire
- 2,0087.2%False Alarm
- 690.2%Overpressure Rupture
- 320.1%Special Incident
- Fire incident types reported to NFIRS in Shawnee, KS
- 1,13148.9%Structure Fires
- 83636.1%Outside Fires
- 29412.7%Mobile Property/Vehicle Fires
- 542.3%Other
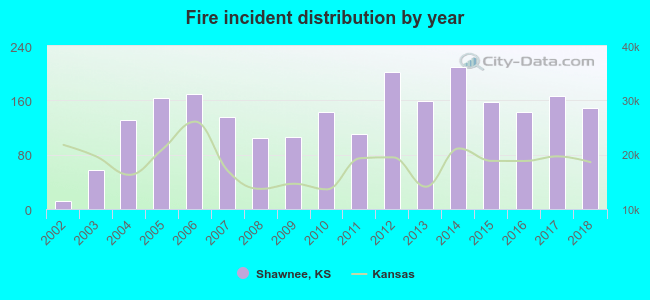 Based on the data from the years 2002 - 2018 the average number of fire incidents per year is 136. The highest number of fires - 209 took place in 2014, and the least - 12 in 2002. The data has an increasing trend.
The average number of yearly fire incidents per 10k residents in Shawnee, KS compared to nearest cities:
(Note: Based on data for the last 3 years, including only cities with population 5,000 and above)
| Shawnee: | 23.6 |
| Lenexa: | 30.4 |
| Merriam: | 38.7 |
| Mission: | 28.1 |
| Overland Park: | 21.0 |
| Roeland Park: | 22.9 |
| Bonner Springs: | 50.3 |
| Prairie Village: | 14.3 |
| Kansas City: | 42.0 |
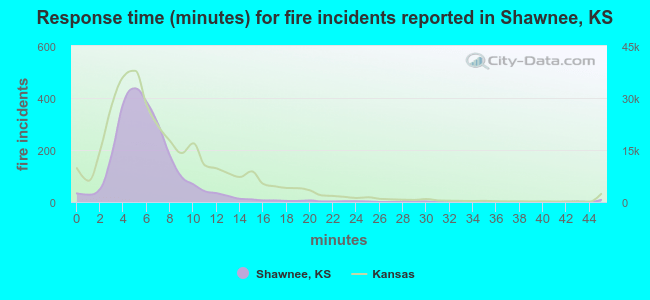 The median response time based on all reported fire incidents is 6 minutes. This is close to the Kansas median value.
The median response time in Shawnee, KS compared to nearest cities:
(Note: Based on data for all years, including only cities with at least 500 fire incidents)
| Shawnee: | 6 minutes |
| Lenexa: | 5 minutes |
| Merriam: | 5 minutes |
| Overland Park: | 6 minutes |
| Bonner Springs: | 8 minutes |
| Kansas City: | 5 minutes |
| Olathe: | 5 minutes |
| Leawood: | 5 minutes |
| Basehor: | 7 minutes |
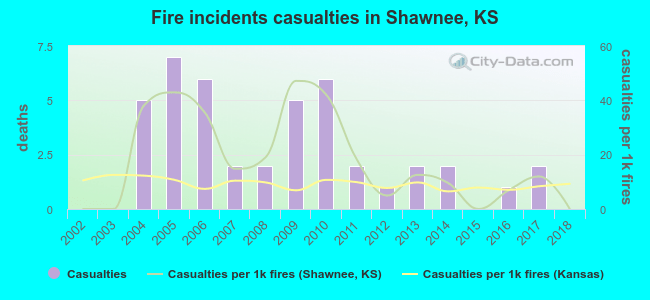 According to the data from the years 2002 - 2018 the average number of fire-related casualties per year is 3. The highest number of injuries - 7 took place in 2005, and the lowest - 0 in 2002. The data has a constant trend.
The average number of injuries per 1,000 fire incidents is 18. This indicator was the highest - 47 in 2009, and the lowest 0 in 2002. The trend for casualties per 1,000 fires is declining. Compared to the Kansas value the number of injuries per 1,000 fire incidents is much higher.
According to the data from the years 2002 - 2018 the average number of fire-related casualties per year is 3. The highest number of injuries - 7 took place in 2005, and the lowest - 0 in 2002. The data has a constant trend.
The average number of injuries per 1,000 fire incidents is 18. This indicator was the highest - 47 in 2009, and the lowest 0 in 2002. The trend for casualties per 1,000 fires is declining. Compared to the Kansas value the number of injuries per 1,000 fire incidents is much higher.Casualties per 1,000 incidents in Shawnee, KS compared to nearest cities:
(Note: Based on data for all years, including only cities with at least 500 fire incidents)
| Shawnee: | 18.6 |
| Lenexa: | 17.0 |
| Merriam: | 9.6 |
| Overland Park: | 25.7 |
| Bonner Springs: | 5.5 |
| Kansas City: | 13.3 |
| Olathe: | 17.6 |
| Leawood: | 8.3 |
| Basehor: | 1.1 |
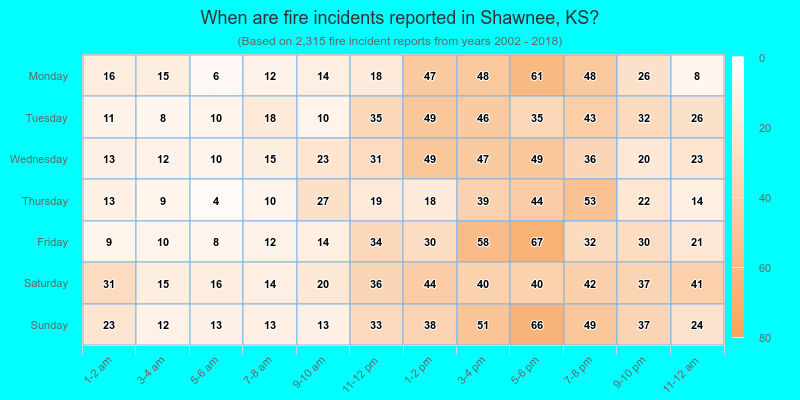
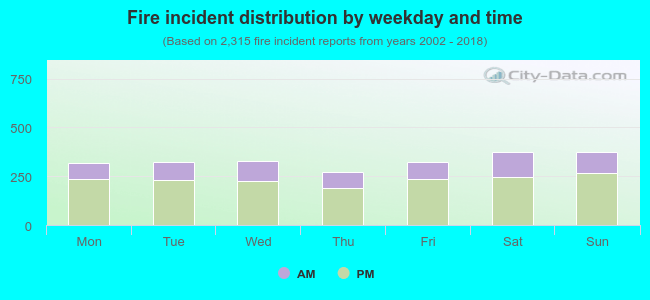 29.6% incidents where reported in the morning and 70.4% in the evening. The most fires (16.2%) took place on Saturday, and the least (11.7%) on Thursday.
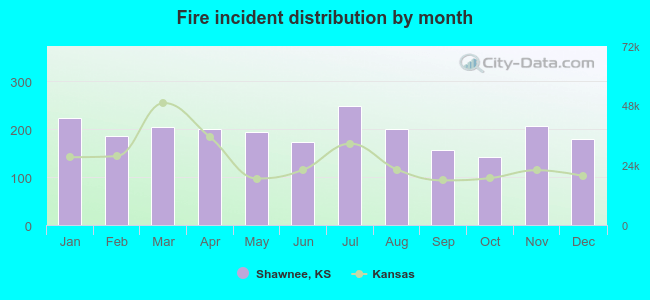 According to the 2,315 fire incidents from years 2002 - 2018 most fires (10.8%) took place during July, and the least (6.1%) in October.
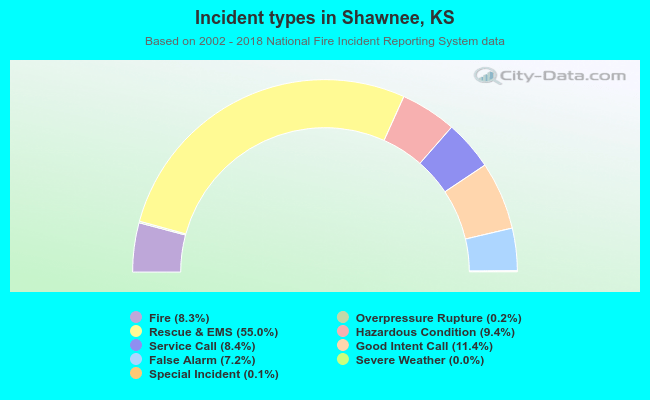 Out of all 28,020 cases reported during the years 2002 - 2018, the most belonged to the categories: Rescue & EMS (55.0%), Good Intent Call (11.4%), and Hazardous Condition (9.4%).
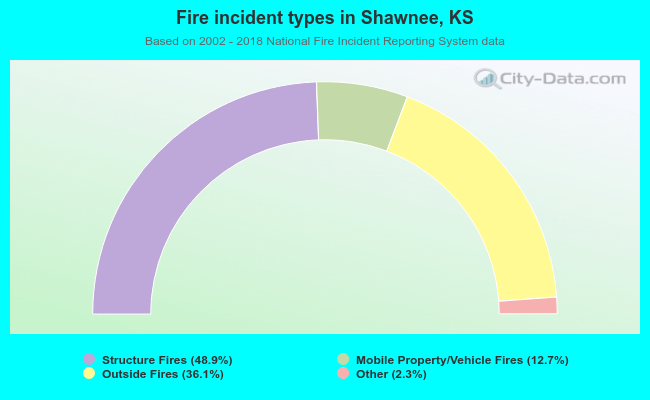 When looking into fire subcategories, the most reports belonged to: Structure Fires (48.9%), and Outside Fires (36.1%).