Decatur: Fire Incidents, Arkansas (AR)
Where are fire incidents reported in Decatur, AR
Something went wrong! Please refresh the page.
|
| |||||||||||||||||||||||||||||||||||||||||||||||||||||||||||||||||||||||||||||||||||||||||||||||||||||||||||||
| Other | 2 | |||||||||||||||||||||||||||||||||||||||||||||||||||||||||||||||||||||||||||||||||||||||||||||||||||||||||||||
2002 - 2018 National Fire Incident Reporting System (NFIRS) incidents
- Incident types reported to NFIRS in Decatur, AR
- 64065.3%Rescue & EMS
- 14214.5%Fire
- 12512.8%Good Intent Call
- 293.0%Hazardous Condition
- 293.0%False Alarm
- 111.1%Service Call
- 20.2%Special Incident
- 10.1%Overpressure Rupture
- 10.1%Severe Weather
- Fire incident types reported to NFIRS in Decatur, AR
- 8559.9%Structure Fires
- 4330.3%Outside Fires
- 96.3%Other
- 53.5%Mobile Property/Vehicle Fires
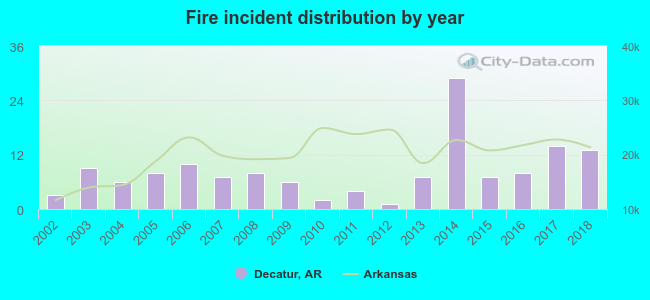 According to the data from the years 2002 - 2018 the average number of fires per year is 8. The highest number of fire incidents - 29 took place in 2014, and the least - 1 in 2012. The data has a rising trend.
 34.5% incidents where reported in the morning and 65.5% in the evening. The most fires (19.0%) took place on Saturday, and the least (8.5%) on Tuesday.
 According to the 142 incident reports from years 2002 - 2018 most fires (16.2%) took place during January, and the least (4.2%) in June.
 Out of all 980 cases reported during the years 2002 - 2018, the most belonged to the categories: Rescue & EMS (65.3%), Fire (14.5%), and Good Intent Call (12.8%).
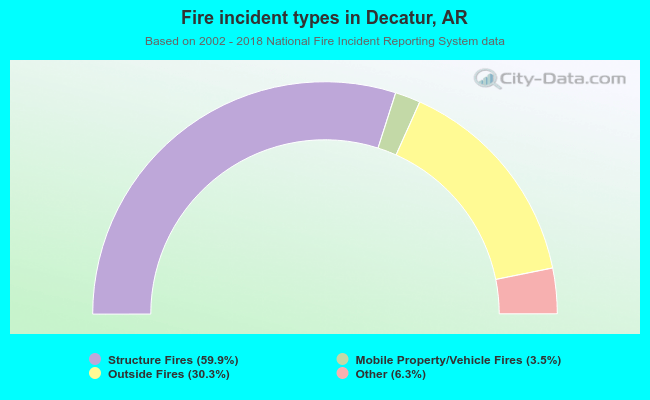 When looking into fire subcategories, the most incidents belonged to: Structure Fires (59.9%), and Outside Fires (30.3%).