| Fire incidents reported |
|---|
| Sreet name | Count |
|---|
| DEERING CENTER RD | 30 | | MARTIN RD | 20 | | DEERING CENTER ROAD | 18 | | RESERVOIR RD | 16 | | MARTIN ROAD | 10 | | OLD COUNTY RD | 10 | | EAST DEERING ROAD | 8 | | HEDGEHOG MOUNTAIN RD | 8 | | RESERVOIR RD | 8 | | RESERVOIR ROAD | 8 | | SECOND NH TRNPK | 8 | | SECOND NH TURNPIKE | 8 | | WOLF HILL RD | 8 | | BARNES ROAD | 6 | | BOWEN SCHOOL RD | 6 | | DEERING CENTER | 6 | | DEERING RD | 6 | | LONGWOODS RD | 6 | | MILL ST | 6 | | OLD COUNTY RD | 6 | | 2ND NH TURNPIK | 4 | | 2ND NH TURNPIKE N | 4 | | BARNES RD | 4 | | CROSS RD | 4 | | DEERING CENTER RD | 4 |
| | | Fire incidents reported |
|---|
| Sreet name | Count |
|---|
| DICKEY HILL RD | 4 | | DONOVAN ROAD | 4 | | FISH AND GAME RDS | 4 | | FISHER RD | 4 | | GLEN RD | 4 | | GLEN ROAD | 4 | | GOVE RD | 4 | | HOMESTEAD RD | 4 | | LAKE SHORE DR | 4 | | NORTH RD | 4 | | RIDGEVIEW RD | 4 | | SECOND N.H. TPK. | 4 | | SKY FARM RD | 4 | | TUBBS HILL RD | 4 | | WOLF HILL RD | 4 | | WOLF HILL ROAD | 4 | | WOODS HOLE ST | 4 | | ZOSKI RD | 4 | | 2ND NH TURNPIKE | 2 | | 2ND NH TURNPIKE RD | 2 | | BALDWIN ROAD | 2 | | BARNES | 2 | | BENNINGTON DEPOT ROAD | 2 | | BLUEBERRY HILL ROAD | 2 | | |
|
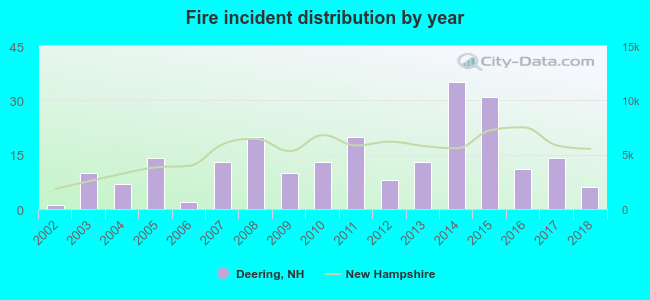 According to the data from the years 2002 - 2018 the average number of fire incidents per year is 13. The highest number of fire incidents - 35 took place in 2014, and the least - 1 in 2002. The data has a rising trend.
 30.3% incidents where reported in the morning and 69.7% in the evening. The most fires (20.2%) took place on Thursday, and the least (8.8%) on Sunday.
 According to the 228 incident reports from years 2002 - 2018 most fires (16.7%) took place during April, and the least (2.2%) in October.
 Out of all 1,064 cases reported during the years 2002 - 2018, the most belonged to the categories: Rescue & EMS (51.1%), Fire (21.4%), and Hazardous Condition (10.8%).
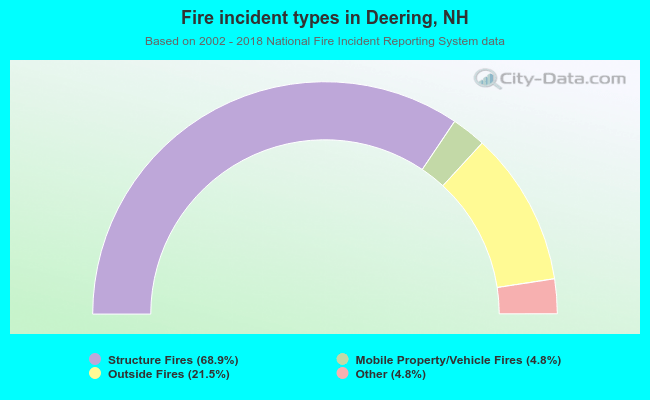 When looking into fire subcategories, the most reports belonged to: Structure Fires (68.9%), and Outside Fires (21.5%).