Denton: Fire Incidents, North Carolina (NC)
Where are fire incidents reported in Denton, NC
Something went wrong! Please refresh the page.
|
| |||||||||||||||||||||||||||||||||||||||||||||||||||||||||||||||||||||||||||||||||||||||||||||||||||||||||||||
| Other | 231 | |||||||||||||||||||||||||||||||||||||||||||||||||||||||||||||||||||||||||||||||||||||||||||||||||||||||||||||
2002 - 2018 National Fire Incident Reporting System (NFIRS) incidents
- Incident types reported to NFIRS in Denton, NC
- 1,12428.6%Rescue & EMS
- 1,00125.5%Fire
- 61515.7%Hazardous Condition
- 55514.1%Good Intent Call
- 40410.3%Service Call
- 1975.0%False Alarm
- 230.6%Severe Weather
- 60.2%Special Incident
- 40.1%Overpressure Rupture
- Fire incident types reported to NFIRS in Denton, NC
- 50850.7%Structure Fires
- 31831.8%Outside Fires
- 11711.7%Mobile Property/Vehicle Fires
- 585.8%Other
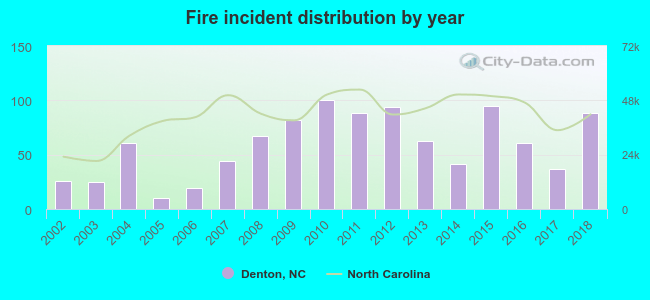 Based on the data from the years 2002 - 2018 the average number of fires per year is 59. The highest number of fires - 100 took place in 2010, and the least - 10 in 2005. The data has an increasing trend.
 The median response time based on all reported fire incidents is 8 minutes. This is higher than the North Carolina median value.
The median response time in Denton, NC compared to nearest cities:
(Note: Based on data for all years, including only cities with at least 500 fire incidents)
| Denton: | 8 minutes |
| Lexington: | 7 minutes |
| Rockwell: | 8 minutes |
| Trinity: | 6 minutes |
| Thomasville: | 6 minutes |
| Asheboro: | 6 minutes |
| Albemarle: | 6 minutes |
| Seagrove: | 10 minutes |
| Archdale: | 5 minutes |
 29.3% incidents where reported in the morning and 70.7% in the evening. The most fires (15.3%) took place on Monday, and the least (13.0%) on Wednesday.
 According to the 1,001 fires from years 2002 - 2018 most fires (13.0%) took place during January, and the least (4.1%) in September.
 Out of all 3,929 cases reported during the years 2002 - 2018, the most belonged to the categories: Rescue & EMS (28.6%), Fire (25.5%), and Hazardous Condition (15.7%).
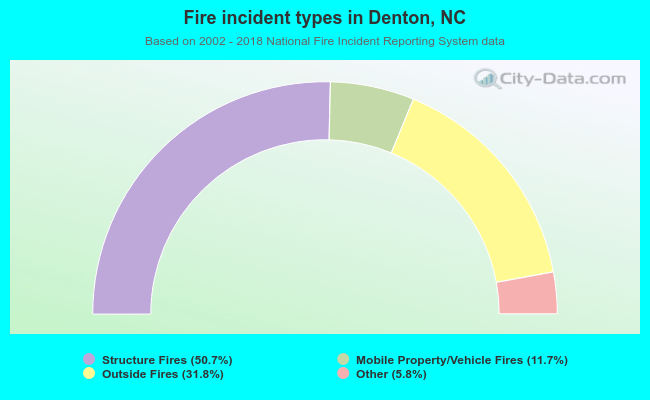 When looking into fire subcategories, the most reports belonged to: Structure Fires (50.7%), and Outside Fires (31.8%).