Lexington: Fire Incidents, North Carolina (NC)
Where are fire incidents reported in Lexington, NC
Something went wrong! Please refresh the page.
| Fire incidents reported | |
|---|---|
| Sreet name | Count |
| I 85 HWY | 132 |
| MAIN ST | 118 |
| OLD HWY 64 | 104 |
| NC HWY | 102 |
| OLD US 52 HWY | 102 |
| US 52 HWY | 92 |
| US 64 HWY | 86 |
| LEONARD RD | 84 |
| MEADOW DR | 74 |
| OLD US HWY | 74 |
| BECKY HILL RD | 68 |
| CENTER ST | 66 |
| COTTON GROVE RD | 62 |
| NC HIGHWAY 150 HWY | 62 |
| I 85 | 60 |
| I85 HWY | 56 |
| RIDGE RD | 56 |
| HORSESHOE NECK RD | 54 |
| NC HWY 8 | 52 |
| ARNOLD RD | 46 |
| BECKS CHURCH RD | 46 |
| FAIRVIEW DR | 46 |
| GILES RD | 46 |
| US 52 | 46 |
| GREENSBORO ST | 44 |
| HOOVER RD | 44 |
| NC 150 HWY | 44 |
| YADKIN COLLEGE RD | 44 |
| ENTERPRISE RD | 42 |
| HWY 150 HWY | 42 |
| Other | 4,004 |
2002 - 2018 National Fire Incident Reporting System (NFIRS) incidents
- Incident types reported to NFIRS in Lexington, NC
- 8,41626.5%Rescue & EMS
- 8,11725.6%Hazardous Condition
- 5,99818.9%Fire
- 3,63711.5%Good Intent Call
- 2,7738.7%False Alarm
- 2,1966.9%Service Call
- 4411.4%Severe Weather
- 1020.3%Overpressure Rupture
- 500.2%Special Incident
- Fire incident types reported to NFIRS in Lexington, NC
- 2,70545.1%Structure Fires
- 2,11235.2%Outside Fires
- 83814.0%Mobile Property/Vehicle Fires
- 3435.7%Other
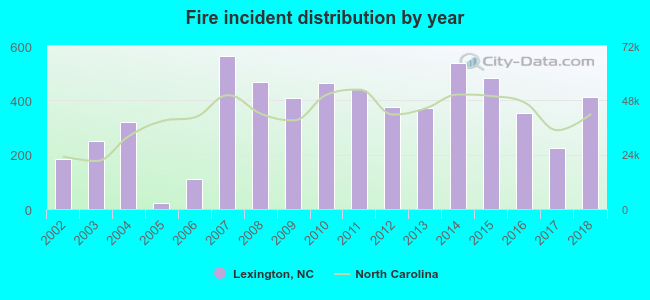 Based on the data from the years 2002 - 2018 the average number of fire incidents per year is 353. The highest number of reported fires - 563 took place in 2007, and the least - 23 in 2005. The data has a growing trend.
The average number of yearly fire incidents per 10k residents in Lexington, NC compared to nearest cities:
(Note: Based on data for the last 3 years, including only cities with population 5,000 and above)
| Lexington: | 172.1 |
| Thomasville: | 78.8 |
| Trinity: | 78.1 |
| Salisbury: | 116.0 |
| Clemmons: | 41.7 |
| Archdale: | 54.0 |
| Mocksville: | 327.2 |
| High Point: | 21.2 |
| Lewisville: | 43.7 |
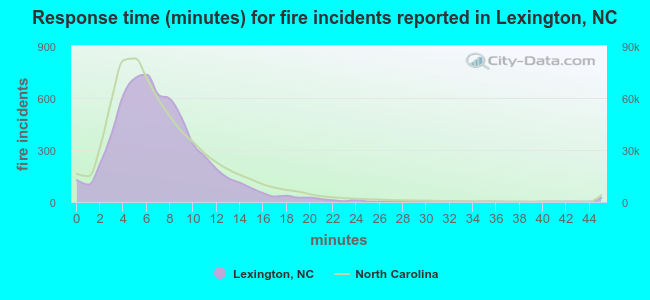 The median response time based on all reported fire incidents is 7 minutes. This is about the same as the North Carolina median value.
The median response time in Lexington, NC compared to nearest cities:
(Note: Based on data for all years, including only cities with at least 500 fire incidents)
| Lexington: | 7 minutes |
| Thomasville: | 6 minutes |
| Advance: | 7 minutes |
| Trinity: | 6 minutes |
| Denton: | 8 minutes |
| Salisbury: | 7 minutes |
| Clemmons: | 7 minutes |
| Archdale: | 5 minutes |
| Mocksville: | 7 minutes |
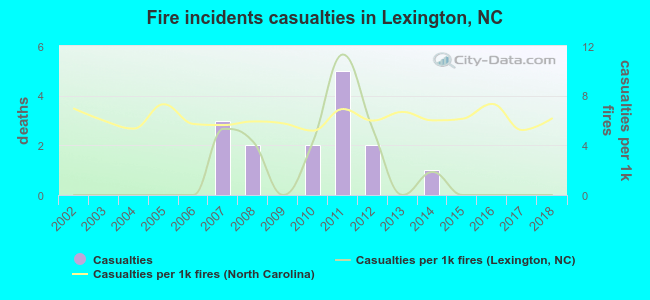 Based on the reports from the years 2002 - 2018 the average number of fire-related casualties per year is 1. The highest number of reported casualties - 5 took place in 2011, and the lowest - 0 in 2002. The data has a constant trend.
The average number of injuries per 1,000 fire incidents is 2. This indicator was the highest - 11 in 2011, and the lowest 0 in 2002. The trend for injuries per 1,000 incidents is constant. Compared to the North Carolina value the number of casualties per 1,000 fires is much lower.
Based on the reports from the years 2002 - 2018 the average number of fire-related casualties per year is 1. The highest number of reported casualties - 5 took place in 2011, and the lowest - 0 in 2002. The data has a constant trend.
The average number of injuries per 1,000 fire incidents is 2. This indicator was the highest - 11 in 2011, and the lowest 0 in 2002. The trend for injuries per 1,000 incidents is constant. Compared to the North Carolina value the number of casualties per 1,000 fires is much lower.Casualties per 1,000 incidents in Lexington, NC compared to nearest cities:
(Note: Based on data for all years, including only cities with at least 500 fire incidents)
| Lexington: | 2.5 |
| Thomasville: | 3.0 |
| Advance: | 8.9 |
| Trinity: | 9.5 |
| Denton: | 0.0 |
| Salisbury: | 4.6 |
| Clemmons: | 19.2 |
| Archdale: | 10.1 |
| Mocksville: | 5.7 |
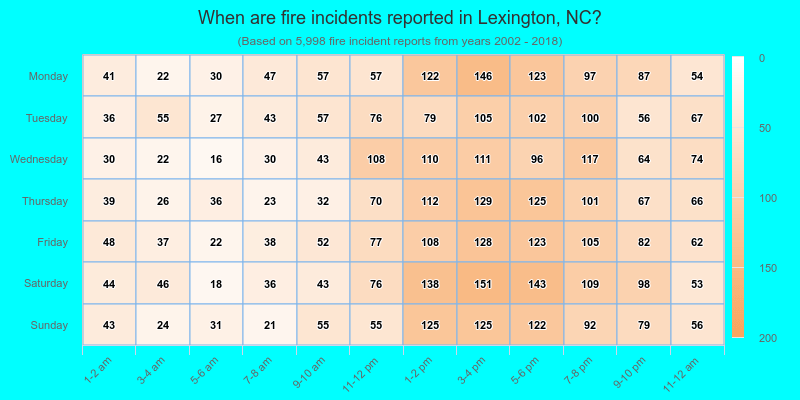
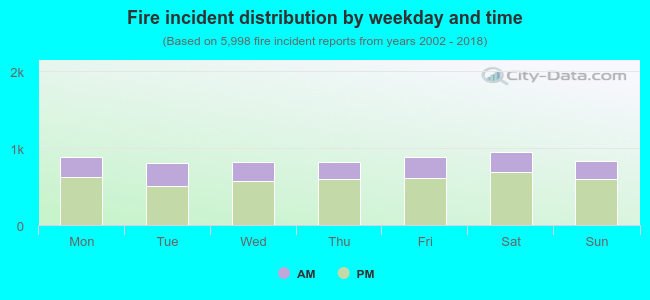 29.8% incidents where reported in the morning and 70.2% in the evening. The most fires (15.9%) took place on Saturday, and the least (13.4%) on Tuesday.
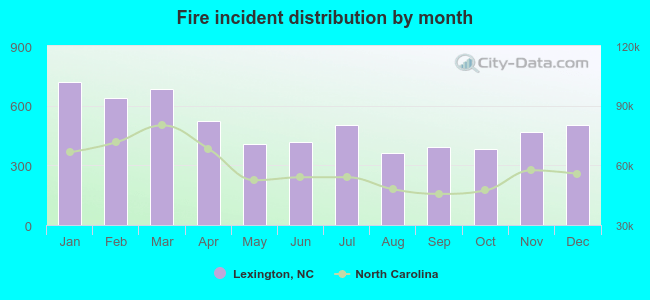 According to the 5,998 fire incident reports from years 2002 - 2018 most fires (12.0%) took place during January, and the least (6.1%) in August.
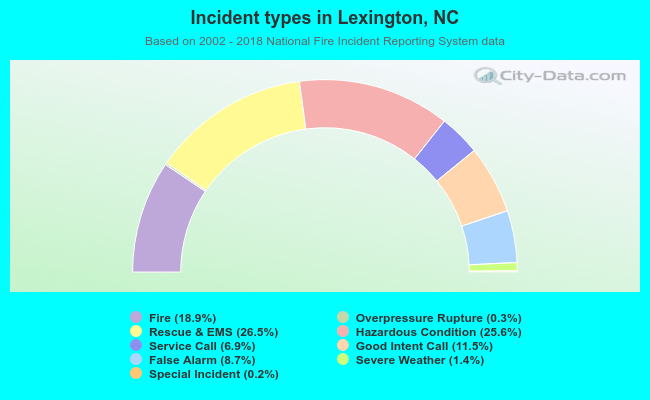 Out of all 31,730 cases reported during the years 2002 - 2018, the most belonged to the categories: Rescue & EMS (26.5%), Hazardous Condition (25.6%), and Fire (18.9%).
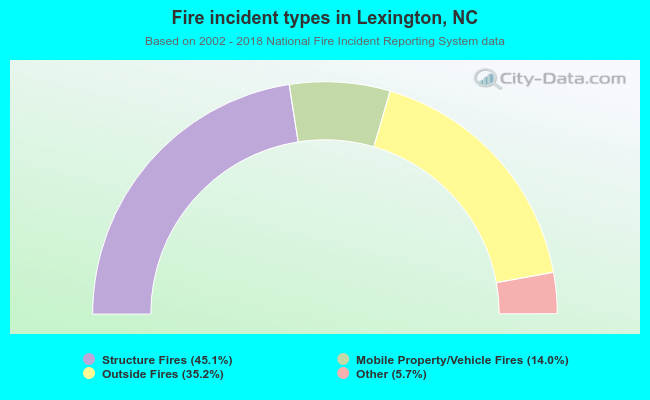 When looking into fire subcategories, the most incidents belonged to: Structure Fires (45.1%), and Outside Fires (35.2%).