Denver: Fire Incidents, Colorado (CO)
Where are fire incidents reported in Denver, CO
Something went wrong! Please refresh the page.
| Fire incidents reported | |
|---|---|
| Sreet name | Count |
| FEDERAL BLVD | 1,404 |
| COLFAX AVE | 780 |
| WASHINGTON ST | 634 |
| PENA BLVD | 562 |
| LOWELL BLVD | 556 |
| YORK ST | 480 |
| COLORADO BLVD | 476 |
| DOWNING ST | 466 |
| ALAMEDA AVE | 462 |
| LOGAN ST | 462 |
| SHERIDAN BLVD | 462 |
| QUEBEC ST | 460 |
| MISSISSIPPI AVE | 432 |
| YALE AVE | 426 |
| MEADE ST | 406 |
| 14TH AVE | 400 |
| BROADWAY | 398 |
| EVANS AVE | 396 |
| BROADWAY ST | 392 |
| FRANKLIN ST | 386 |
| PECOS ST | 378 |
| NEWTON ST | 376 |
| GRANT ST | 356 |
| DARTMOUTH AVE | 350 |
| LARIMER ST | 342 |
| HIGH ST | 340 |
| LINCOLN ST | 340 |
| SHERMAN ST | 332 |
| OSCEOLA ST | 326 |
| HARVARD AVE | 322 |
| Other | 23,771 |
2002 - 2018 National Fire Incident Reporting System (NFIRS) incidents
- Incident types reported to NFIRS in Denver, CO
- 347,29459.8%Rescue & EMS
- 58,69510.1%False Alarm
- 56,9219.8%Good Intent Call
- 48,5468.4%Hazardous Condition
- 37,6736.5%Fire
- 29,3215.1%Service Call
- 1,1350.2%Special Incident
- 6640.1%Overpressure Rupture
- Fire incident types reported to NFIRS in Denver, CO
- 17,53446.5%Outside Fires
- 12,22232.4%Structure Fires
- 6,05216.1%Mobile Property/Vehicle Fires
- 1,8655.0%Other
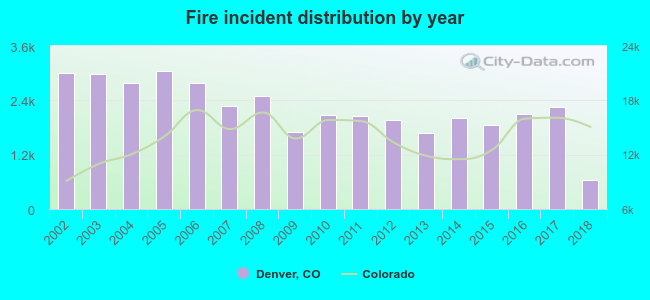 Based on the data from the years 2002 - 2018 the average number of fire incidents per year is 2,216. The highest number of fire incidents - 3,038 took place in 2005, and the least - 636 in 2018. The data has a decreasing trend.
The average number of yearly fire incidents per 10k residents in Denver, CO compared to nearest cities:
(Note: Based on data for the last 3 years, including only cities with population 5,000 and above)
| Denver: | 25.0 |
| Glendale: | 18.9 |
| Englewood: | 46.5 |
| Sheridan: | 45.9 |
| Cherry Hills Village: | 13.5 |
| Lakewood: | 24.8 |
| Wheat Ridge: | 29.3 |
| Greenwood Village: | 12.1 |
| Welby: | 0.7 |
 The median response time based on all reported fire incidents is 4 minutes. This is lower than the Colorado median value.
The median response time in Denver, CO compared to nearest cities:
(Note: Based on data for all years, including only cities with at least 500 fire incidents)
| Denver: | 4 minutes |
| Englewood: | 6 minutes |
| Sheridan: | 4 minutes |
| Lakewood: | 5 minutes |
| Wheat Ridge: | 5 minutes |
| Commerce City: | 5 minutes |
| Aurora: | 6 minutes |
| Littleton: | 7 minutes |
| Federal Heights: | 5 minutes |
 According to the reports from the years 2002 - 2018 the average number of fire-related fatalities per year is 2. The highest number of reported deaths - 6 took place in 2006, and the lowest - 0 in 2012. The data has a declining trend.
The average number of fatalities per 1,000 fires is 1. This indicator was the highest - 2 in 2006, and the lowest 0 in 2012. The trend for deaths per 1,000 incidents is declining. Compared to the Colorado value the number of fatalities per 1,000 incidents is lower.
According to the reports from the years 2002 - 2018 the average number of fire-related fatalities per year is 2. The highest number of reported deaths - 6 took place in 2006, and the lowest - 0 in 2012. The data has a declining trend.
The average number of fatalities per 1,000 fires is 1. This indicator was the highest - 2 in 2006, and the lowest 0 in 2012. The trend for deaths per 1,000 incidents is declining. Compared to the Colorado value the number of fatalities per 1,000 incidents is lower.
 Based on the reports from the years 2002 - 2018 the average number of fire-related yearly casualties is 46. The highest number of casualties - 94 took place in 2008, and the lowest - 4 in 2018. The data has a dropping trend.
The average number of casualties per 1,000 fires is 20. This indicator was the highest - 38 in 2008, and the lowest 6 in 2018. The trend for injuries per 1,000 fire incidents is dropping. Compared to the Colorado value the number of injuries per 1,000 incidents is higher.
Based on the reports from the years 2002 - 2018 the average number of fire-related yearly casualties is 46. The highest number of casualties - 94 took place in 2008, and the lowest - 4 in 2018. The data has a dropping trend.
The average number of casualties per 1,000 fires is 20. This indicator was the highest - 38 in 2008, and the lowest 6 in 2018. The trend for injuries per 1,000 fire incidents is dropping. Compared to the Colorado value the number of injuries per 1,000 incidents is higher.Casualties per 1,000 incidents in Denver, CO compared to nearest cities:
(Note: Based on data for all years, including only cities with at least 500 fire incidents)
| Denver: | 20.6 |
| Englewood: | 10.1 |
| Sheridan: | 17.1 |
| Lakewood: | 36.1 |
| Wheat Ridge: | 9.2 |
| Commerce City: | 12.1 |
| Aurora: | 10.6 |
| Littleton: | 19.8 |
| Federal Heights: | 21.2 |
 32.9% incidents where reported in the morning and 67.1% in the evening. The most fires (15.0%) took place on Sunday, and the least (13.6%) on Thursday.
 According to the 37,673 fires from years 2002 - 2018 most fires (11.7%) took place during July, and the least (6.8%) in February.
 Out of all 580,344 cases reported during the years 2002 - 2018, the most belonged to the categories: Rescue & EMS (59.8%), False Alarm (10.1%), and Good Intent Call (9.8%).
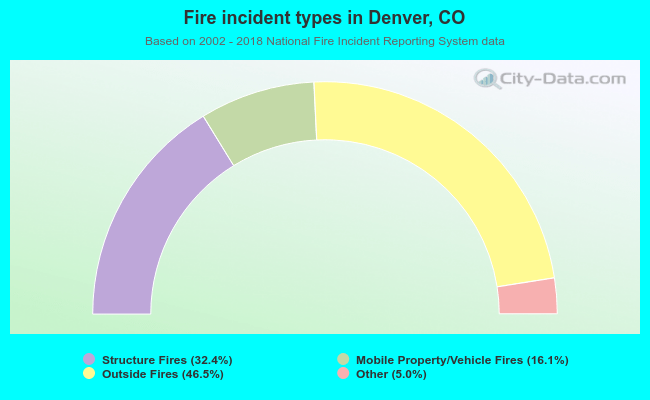 When looking into fire subcategories, the most incidents belonged to: Outside Fires (46.5%), and Structure Fires (32.4%).