Westminster: Fire Incidents, Colorado (CO)
Where are fire incidents reported in Westminster, CO
Something went wrong! Please refresh the page.
| Fire incidents reported | |
|---|---|
| Sreet name | Count |
| SHERIDAN BLVD | 232 |
| FEDERAL BLVD | 200 |
| SHERIDAN BLVD | 176 |
| 88TH AVE | 112 |
| 72ND AVE | 100 |
| FEDERAL BLVD | 98 |
| 72ND AVE | 90 |
| LOWELL BLVD | 84 |
| 120TH AVE | 76 |
| WB HWY 36 | 70 |
| 92ND AVE | 66 |
| 120TH AVE | 62 |
| 104TH AVE | 56 |
| 68TH AVE | 56 |
| 76TH AVE | 56 |
| STUART ST | 56 |
| EB HWY 36 | 54 |
| SB INTERSTATE 25 | 54 |
| WADSWORTH PKY | 54 |
| INGALLS ST | 52 |
| HOOKER ST | 48 |
| 112TH AVE | 46 |
| 123RD AVE | 46 |
| ZUNI ST | 46 |
| 132ND AVE | 44 |
| 73RD AVE | 42 |
| 79TH AVE | 42 |
| LOWELL BLVD | 42 |
| WESTMINSTER BLVD | 40 |
| CHURCH RANCH BLVD | 38 |
| Other | 1,556 |
2002 - 2018 National Fire Incident Reporting System (NFIRS) incidents
- Incident types reported to NFIRS in Westminster, CO
- 40,78663.8%Rescue & EMS
- 6,40910.0%Good Intent Call
- 4,4276.9%Service Call
- 4,2956.7%False Alarm
- 4,0176.3%Hazardous Condition
- 3,7945.9%Fire
- 1090.2%Special Incident
- Fire incident types reported to NFIRS in Westminster, CO
- 1,57341.5%Outside Fires
- 1,46638.6%Structure Fires
- 63316.7%Mobile Property/Vehicle Fires
- 1223.2%Other
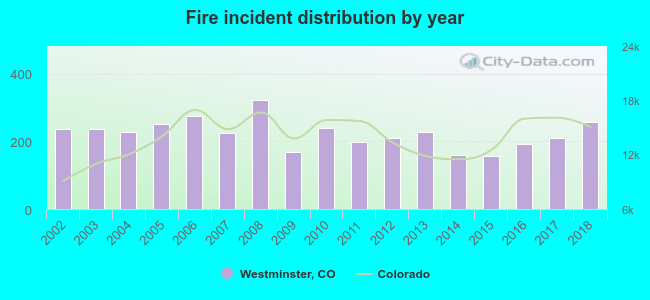 Based on the data from the years 2002 - 2018 the average number of fire incidents per year is 223. The highest number of reported fire incidents - 321 took place in 2008, and the least - 158 in 2015. The data has an increasing trend.
The average number of yearly fire incidents per 10k residents in Westminster, CO compared to nearest cities:
(Note: Based on data for the last 3 years, including only cities with population 5,000 and above)
| Westminster: | 19.6 |
| Federal Heights: | 36.4 |
| Broomfield: | 16.5 |
| Northglenn: | 25.4 |
| Arvada: | 14.3 |
| Welby: | 0.7 |
| Thornton: | 21.3 |
| Superior: | 9.3 |
| Wheat Ridge: | 29.3 |
 The median response time based on all reported fire incidents is 5 minutes. This is lower than the state median value.
The median response time in Westminster, CO compared to nearest cities:
(Note: Based on data for all years, including only cities with at least 500 fire incidents)
| Westminster: | 5 minutes |
| Federal Heights: | 5 minutes |
| Broomfield: | 6 minutes |
| Northglenn: | 6 minutes |
| Arvada: | 5 minutes |
| Thornton: | 7 minutes |
| Wheat Ridge: | 5 minutes |
| Commerce City: | 5 minutes |
| Lafayette: | 5 minutes |
 Based on the data from the years 2002 - 2018 the average number of fire-related fatalities per year is 1. The highest number of deaths - 4 took place in 2018, and the lowest - 0 in 2004. The data has a rising trend.
The average number of deaths per 1,000 fires is 4. This indicator was the highest - 16 in 2018, and the lowest 0 in 2004. The trend for deaths per 1,000 incidents is rising. Compared to the state value the number of fatalities per 1,000 fire incidents is much higher.
Based on the data from the years 2002 - 2018 the average number of fire-related fatalities per year is 1. The highest number of deaths - 4 took place in 2018, and the lowest - 0 in 2004. The data has a rising trend.
The average number of deaths per 1,000 fires is 4. This indicator was the highest - 16 in 2018, and the lowest 0 in 2004. The trend for deaths per 1,000 incidents is rising. Compared to the state value the number of fatalities per 1,000 fire incidents is much higher.
 According to the reports from the years 2002 - 2018 the average number of fire-related yearly casualties is 8. The highest number of reported casualties - 23 took place in 2018, and the lowest - 0 in 2015. The data has a rising trend.
The average number of casualties per 1,000 fires is 34. This indicator was the highest - 89 in 2018, and the lowest 0 in 2015. The trend for casualties per 1,000 fires is growing. Compared to the Colorado value the number of injuries per 1,000 incidents is much higher.
According to the reports from the years 2002 - 2018 the average number of fire-related yearly casualties is 8. The highest number of reported casualties - 23 took place in 2018, and the lowest - 0 in 2015. The data has a rising trend.
The average number of casualties per 1,000 fires is 34. This indicator was the highest - 89 in 2018, and the lowest 0 in 2015. The trend for casualties per 1,000 fires is growing. Compared to the Colorado value the number of injuries per 1,000 incidents is much higher.Casualties per 1,000 incidents in Westminster, CO compared to nearest cities:
(Note: Based on data for all years, including only cities with at least 500 fire incidents)
| Westminster: | 34.0 |
| Federal Heights: | 21.2 |
| Broomfield: | 11.7 |
| Northglenn: | 9.4 |
| Arvada: | 13.9 |
| Thornton: | 13.9 |
| Wheat Ridge: | 9.2 |
| Commerce City: | 12.1 |
| Lafayette: | 5.1 |
 28.7% incidents where reported in the morning and 71.3% in the evening. The most fires (15.6%) took place on Monday, and the least (12.0%) on Wednesday.
 According to the 3,794 reports from years 2002 - 2018 most fires (12.3%) took place during July, and the least (6.2%) in January.
 Out of all 63,887 cases reported during the years 2002 - 2018, the most belonged to the categories: Rescue & EMS (63.8%), Good Intent Call (10.0%), and Service Call (6.9%).
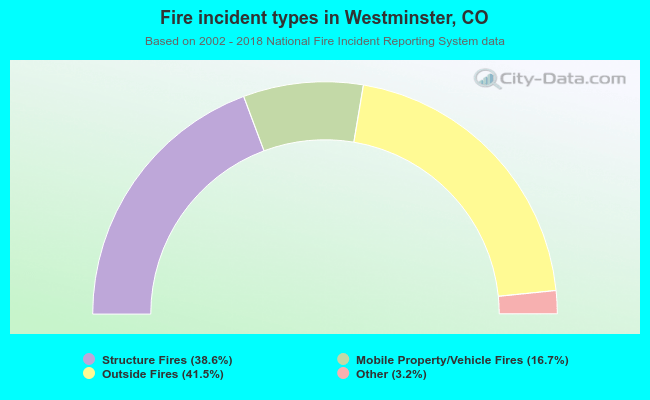 When looking into fire subcategories, the most reports belonged to: Outside Fires (41.5%), and Structure Fires (38.6%).