Des Moines: Fire Incidents, Washington (WA)
Where are fire incidents reported in Des Moines, WA
Something went wrong! Please refresh the page.
| Fire incidents reported | |
|---|---|
| Sreet name | Count |
| PACIFIC HWY | 444 |
| MARINE VIEW DR | 240 |
| 30 AVE | 200 |
| 216 ST | 170 |
| KENT DES MOINES RD | 134 |
| 24 AVE | 110 |
| 16 AVE | 104 |
| 224 ST | 96 |
| 29 AVE | 72 |
| DOCK AVE | 70 |
| 222 ST | 60 |
| 10 AVE | 58 |
| 20 AVE | 58 |
| 260 ST | 58 |
| 240 ST | 46 |
| 25 AVE | 42 |
| 15 AVE | 40 |
| 7 AVE | 40 |
| 8 AVE | 40 |
| 28 AVE | 38 |
| 11 AVE | 36 |
| 18 AVE | 36 |
| 27 AVE | 36 |
| 2 AVE | 34 |
| 272 ST | 34 |
| 26 PL | 32 |
| 13 AVE | 30 |
| 14 AVE | 30 |
| 216TH ST | 30 |
| 4 PL | 30 |
2002 - 2018 National Fire Incident Reporting System (NFIRS) incidents
- Incident types reported to NFIRS in Des Moines, WA
- 12,20062.5%Rescue & EMS
- 2,18711.2%Fire
- 1,5528.0%Good Intent Call
- 1,3076.7%False Alarm
- 1,1626.0%Hazardous Condition
- 9835.0%Service Call
- 500.3%Special Incident
- 420.2%Severe Weather
- 280.1%Overpressure Rupture
- Fire incident types reported to NFIRS in Des Moines, WA
- 1,00546.0%Structure Fires
- 83438.1%Outside Fires
- 28413.0%Mobile Property/Vehicle Fires
- 642.9%Other
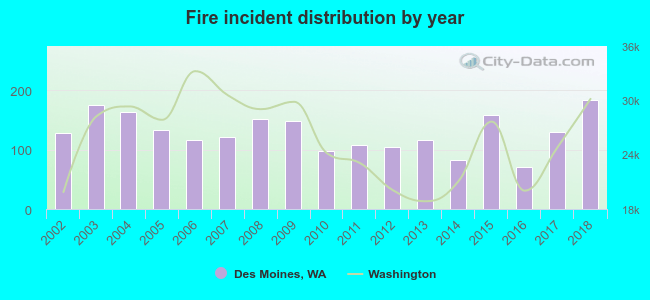 According to the data from the years 2002 - 2018 the average number of fires per year is 129. The highest number of reported fire incidents - 183 took place in 2018, and the least - 70 in 2016. The data has an increasing trend.
The average number of yearly fire incidents per 10k residents in Des Moines, WA compared to nearest cities:
(Note: Based on data for the last 3 years, including only cities with population 5,000 and above)
| Des Moines: | 41.1 |
| Normandy Park: | 13.1 |
| SeaTac: | 44.2 |
| Kent: | 38.4 |
| Burien: | 39.4 |
| Federal Way: | 46.6 |
| Tukwila: | 102.1 |
| Vashon: | 33.6 |
| Auburn: | 54.1 |
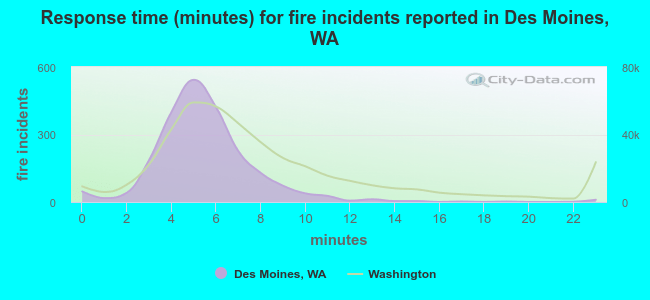 The median response time based on all reported fire incidents is 5 minutes. This is lower than the state median value.
The median response time in Des Moines, WA compared to nearest cities:
(Note: Based on data for all years, including only cities with at least 500 fire incidents)
| Des Moines: | 5 minutes |
| SeaTac: | 5 minutes |
| Kent: | 6 minutes |
| Burien: | 5 minutes |
| Federal Way: | 6 minutes |
| Tukwila: | 6 minutes |
| Vashon: | 8 minutes |
| Auburn: | 6 minutes |
| Renton: | 6 minutes |
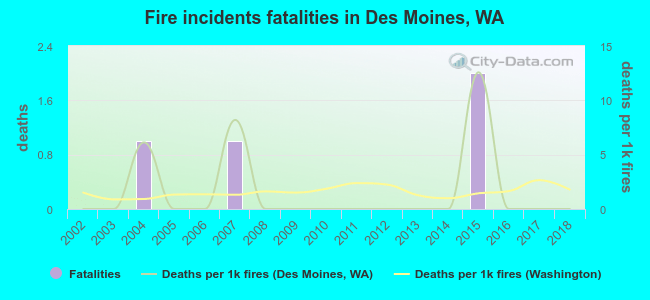 Based on the data from the years 2002 - 2018 the average number of fire-related yearly deaths is 0. The highest number of reported deaths - 2 took place in 2015, and the lowest - 0 in 2002. The data has a constant trend.
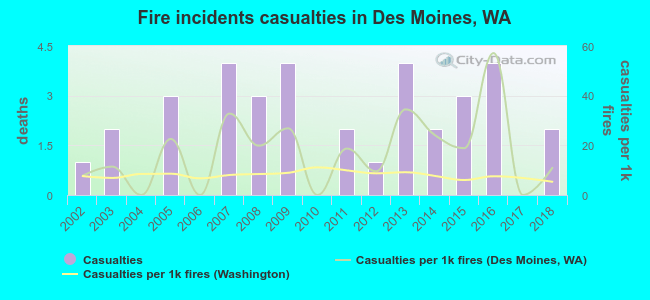 Based on the reports from the years 2002 - 2018 the average number of fire-related casualties per year is 2. The highest number of reported injuries - 4 took place in 2007, and the lowest - 0 in 2004. The data has a growing trend.
The average number of casualties per 1,000 fires is 17. This indicator was the highest - 57 in 2016, and the lowest 0 in 2004. The trend for injuries per 1,000 fire incidents is growing. Compared to the state value the number of injuries per 1,000 incidents is much higher.
Based on the reports from the years 2002 - 2018 the average number of fire-related casualties per year is 2. The highest number of reported injuries - 4 took place in 2007, and the lowest - 0 in 2004. The data has a growing trend.
The average number of casualties per 1,000 fires is 17. This indicator was the highest - 57 in 2016, and the lowest 0 in 2004. The trend for injuries per 1,000 fire incidents is growing. Compared to the state value the number of injuries per 1,000 incidents is much higher.
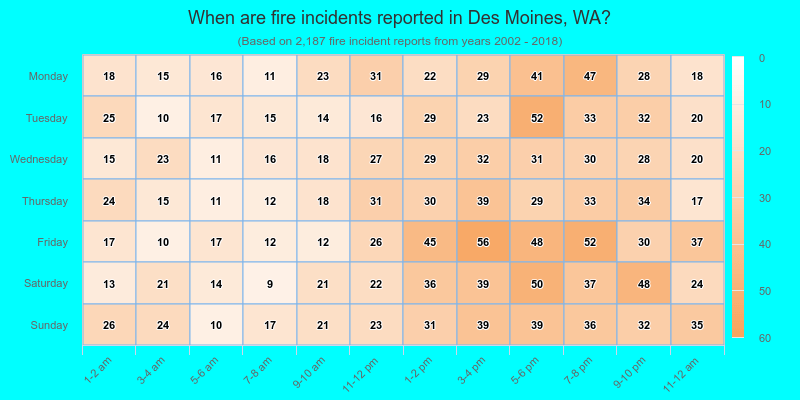
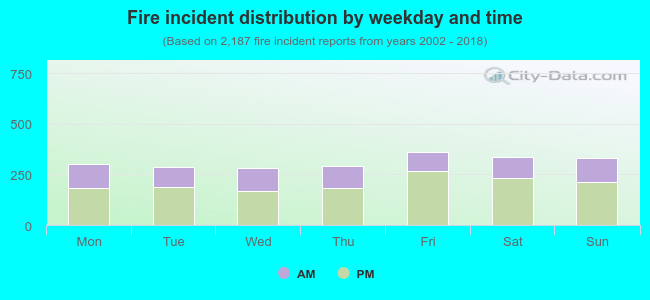 34.2% incidents where reported in the morning and 65.8% in the evening. The most fires (16.6%) took place on Friday, and the least (12.8%) on Wednesday.
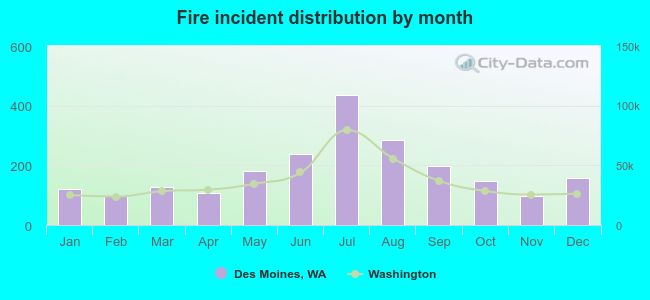 Based on the 2,187 incident reports from years 2002 - 2018 most fires (19.9%) took place during July, and the least (4.4%) in November.
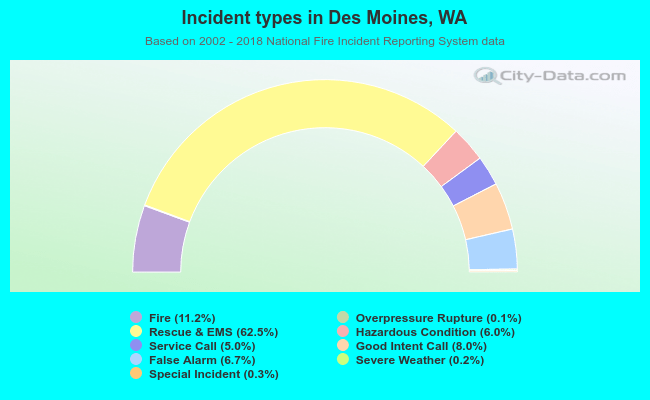 Out of all 19,511 cases reported during the years 2002 - 2018, the most belonged to the categories: Rescue & EMS (62.5%), Fire (11.2%), and Good Intent Call (8.0%).
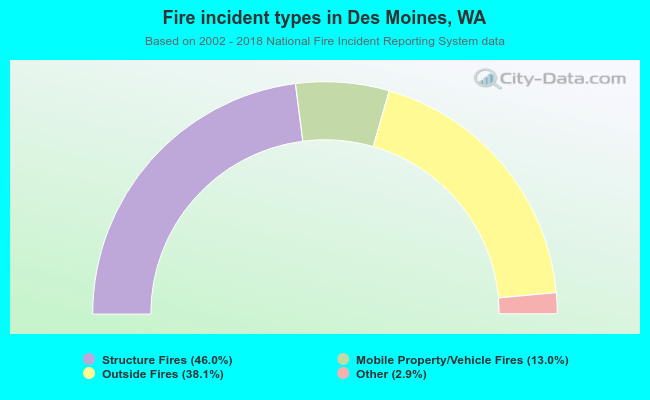 When looking into fire subcategories, the most reports belonged to: Structure Fires (46.0%), and Outside Fires (38.1%).