Normandy Park: Fire Incidents, Washington (WA)
Where are fire incidents reported in Normandy Park, WA
Something went wrong! Please refresh the page.
|
| |||||||||||||||||||||||||||||||||||||||||||||||||||||||||||||||||||||||||||||||||||||||||||||||||||||||||||||
2002 - 2018 National Fire Incident Reporting System (NFIRS) incidents
- Incident types reported to NFIRS in Normandy Park, WA
- 2,49675.2%Rescue & EMS
- 1815.5%Good Intent Call
- 1745.2%Fire
- 1725.2%Hazardous Condition
- 1634.9%False Alarm
- 1223.7%Service Call
- 50.2%Special Incident
- 40.1%Overpressure Rupture
- 40.1%Severe Weather
- Fire incident types reported to NFIRS in Normandy Park, WA
- 9353.4%Structure Fires
- 4727.0%Outside Fires
- 2112.1%Other
- 137.5%Mobile Property/Vehicle Fires
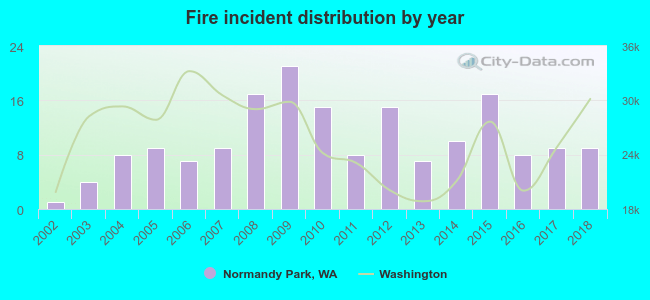 Based on the data from the years 2002 - 2018 the average number of fires per year is 10. The highest number of fire incidents - 21 took place in 2009, and the least - 1 in 2002. The data has an increasing trend.
The average number of yearly fire incidents per 10k residents in Normandy Park, WA compared to nearest cities:
(Note: Based on data for the last 3 years, including only cities with population 5,000 and above)
| Normandy Park: | 13.1 |
| Burien: | 39.4 |
| SeaTac: | 44.2 |
| Des Moines: | 41.1 |
| Tukwila: | 102.1 |
| Vashon: | 33.6 |
| Kent: | 38.4 |
| Renton: | 52.4 |
| Federal Way: | 46.6 |
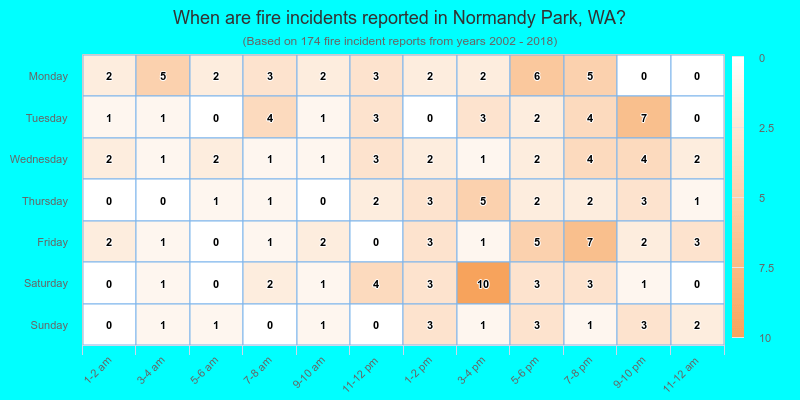
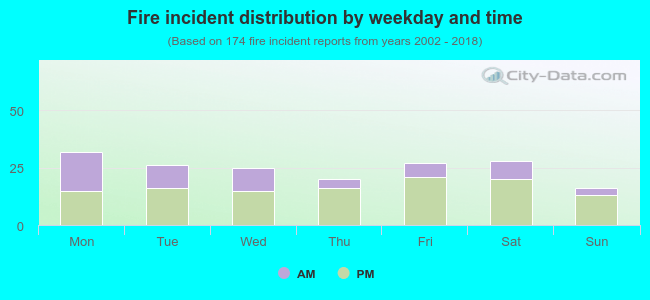 33.3% incidents where reported in the morning and 66.7% in the evening. The most fires (18.4%) took place on Monday, and the least (9.2%) on Sunday.
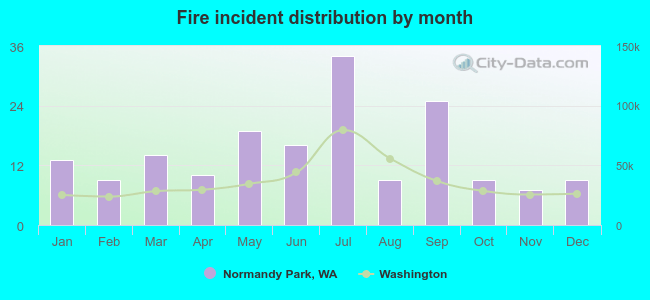 Based on the 174 fires from years 2002 - 2018 most fires (19.5%) took place during July, and the least (4.0%) in November.
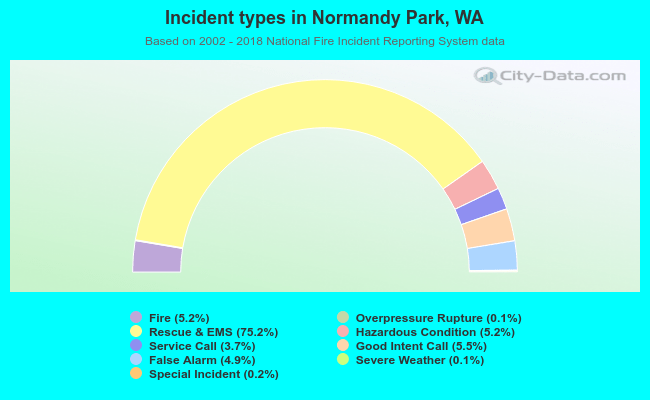 Out of all 3,321 cases reported during the years 2002 - 2018, the most belonged to the categories: Rescue & EMS (75.2%), Good Intent Call (5.5%), and Fire (5.2%).
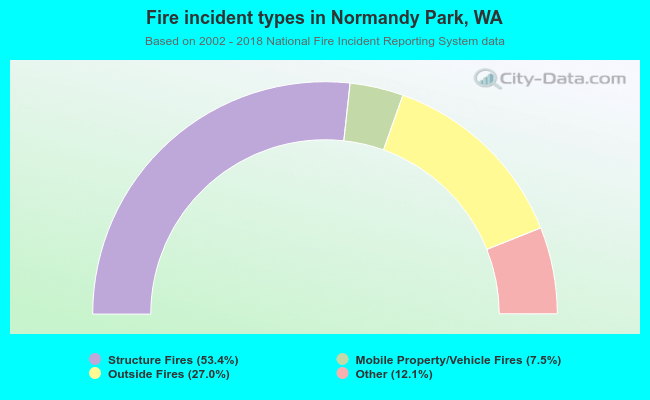 When looking into fire subcategories, the most reports belonged to: Structure Fires (53.4%), and Outside Fires (27.0%).