Desloge: Fire Incidents, Missouri (MO)
Where are fire incidents reported in Desloge, MO
Something went wrong! Please refresh the page.
|
| |||||||||||||||||||||||||||||||||||||||||||||||||||||||||||||||||||||||||||||||||||||||||||||||||||||||||||||
| Other | 45 | |||||||||||||||||||||||||||||||||||||||||||||||||||||||||||||||||||||||||||||||||||||||||||||||||||||||||||||
2002 - 2018 National Fire Incident Reporting System (NFIRS) incidents
- Incident types reported to NFIRS in Desloge, MO
- 98944.6%Rescue & EMS
- 47921.6%Fire
- 30913.9%Good Intent Call
- 26912.1%Hazardous Condition
- 833.7%Service Call
- 652.9%False Alarm
- 231.0%Special Incident
- Fire incident types reported to NFIRS in Desloge, MO
- 29461.4%Structure Fires
- 12526.1%Outside Fires
- 326.7%Mobile Property/Vehicle Fires
- 285.8%Other
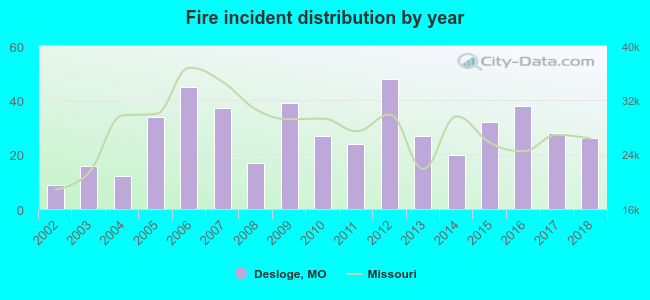 Based on the data from the years 2002 - 2018 the average number of fires per year is 28. The highest number of fires - 48 took place in 2012, and the least - 9 in 2002. The data has a rising trend.
 41.1% incidents where reported in the morning and 58.9% in the evening. The most fires (16.7%) took place on Saturday, and the least (12.3%) on Monday.
 Based on the 479 fire incident reports from years 2002 - 2018 most fires (12.1%) took place during March, and the least (4.8%) in May.
 Out of all 2,219 cases reported during the years 2002 - 2018, the most belonged to the categories: Overpressure Rupture (44.6%), Fire (21.6%), and Service Call (13.9%).
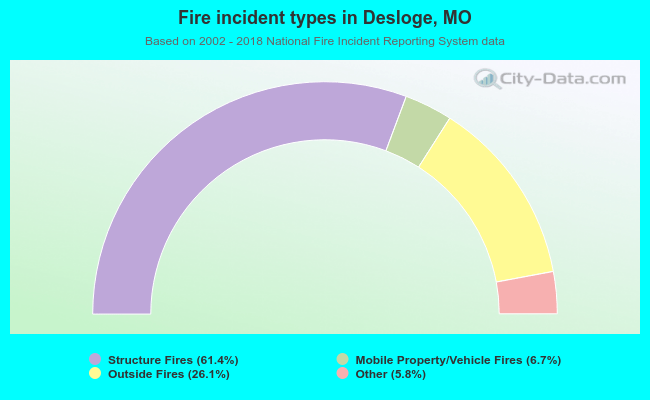 When looking into fire subcategories, the most reports belonged to: Structure Fires (61.4%), and Outside Fires (26.1%).