Devils Lake: Fire Incidents, North Dakota (ND)
Where are fire incidents reported in Devils Lake, ND
Something went wrong! Please refresh the page.
|
| |||||||||||||||||||||||||||||||||||||||||||||||||||||||||||||||||||||||||||||||||||||||||||||||||||||||||||||
2002 - 2018 National Fire Incident Reporting System (NFIRS) incidents
- Incident types reported to NFIRS in Devils Lake, ND
- 1,10545.4%Fire
- 36615.0%Hazardous Condition
- 33913.9%False Alarm
- 28611.8%Rescue & EMS
- 2259.2%Good Intent Call
- 974.0%Service Call
- 110.5%Special Incident
- Fire incident types reported to NFIRS in Devils Lake, ND
- 55250.0%Structure Fires
- 40636.7%Outside Fires
- 13512.2%Mobile Property/Vehicle Fires
- 121.1%Other
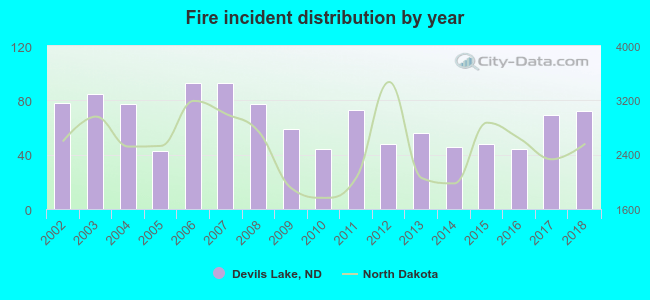 Based on the data from the years 2002 - 2018 the average number of fires per year is 65. The highest number of reported fires - 93 took place in 2006, and the least - 43 in 2005. The data has a declining trend.
The average number of yearly fire incidents per 10k residents in Devils Lake, ND compared to nearest cities:
(Note: Based on data for the last 3 years, including only cities with population 5,000 and above)
| Devils Lake: | 84.6 |
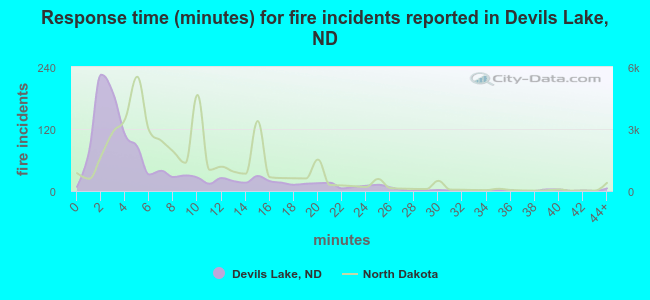 The median response time based on all reported fire incidents is 4 minutes. This is much lower than the North Dakota median value.
The median response time in Devils Lake, ND compared to nearest cities:
(Note: Based on data for all years, including only cities with at least 500 fire incidents)
| Devils Lake: | 4 minutes |
| Rolette: | 8 minutes |
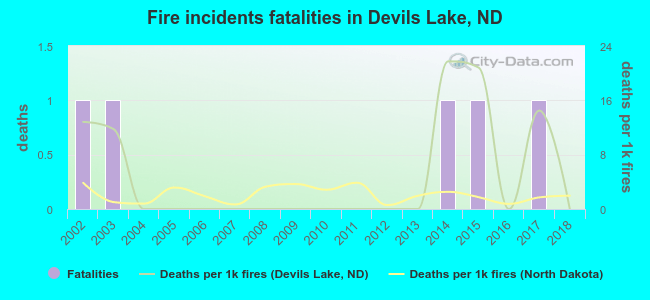 According to the reports from the years 2002 - 2018 the average number of fire-related yearly deaths is 0. The highest number of reported deaths - 1 took place in 2002, and the lowest - 0 in 2004. The data has a declining trend.
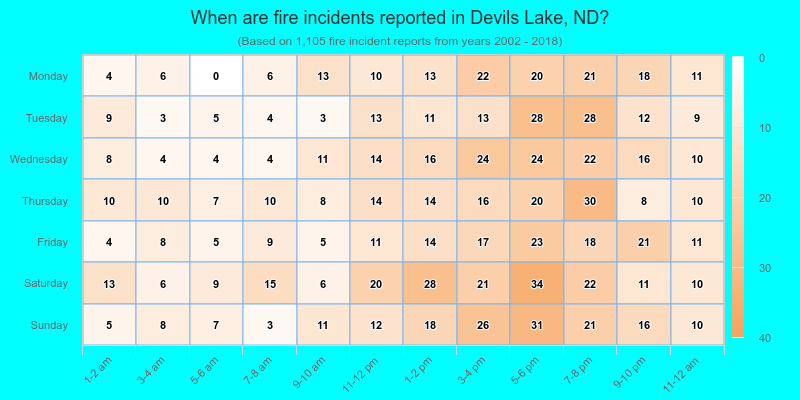
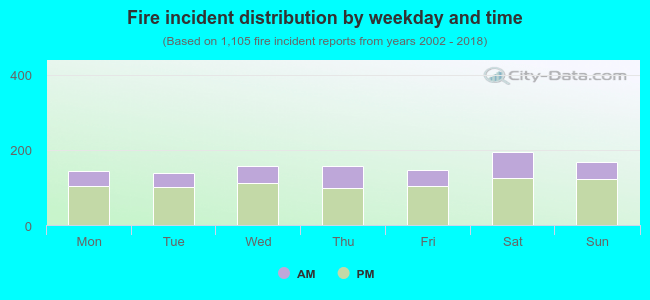 30.5% incidents where reported in the morning and 69.5% in the evening. The most fires (17.6%) took place on Saturday, and the least (12.5%) on Tuesday.
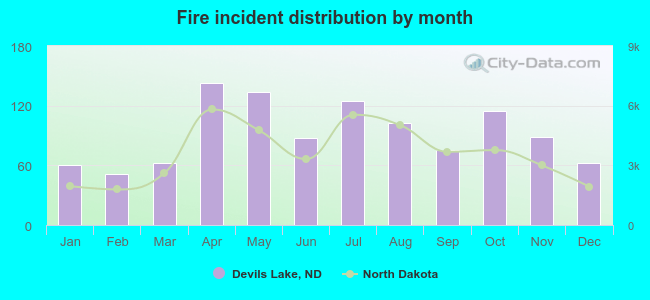 According to the 1,105 fire incident reports from years 2002 - 2018 most fires (12.9%) took place during April, and the least (4.6%) in February.
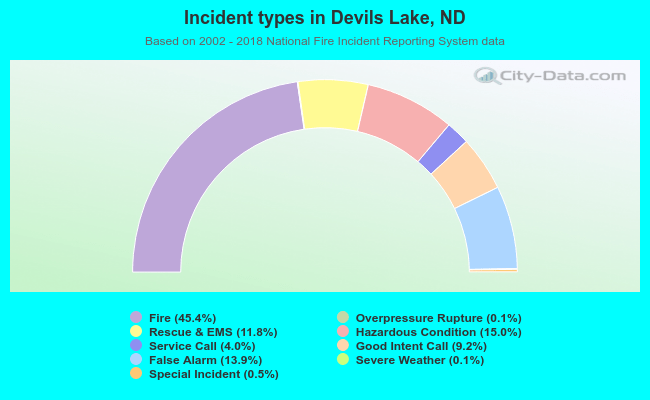 Out of all 2,433 cases reported during the years 2002 - 2018, the most belonged to the categories: Fire (45.4%), Hazardous Condition (15.0%), and False Alarm (13.9%).
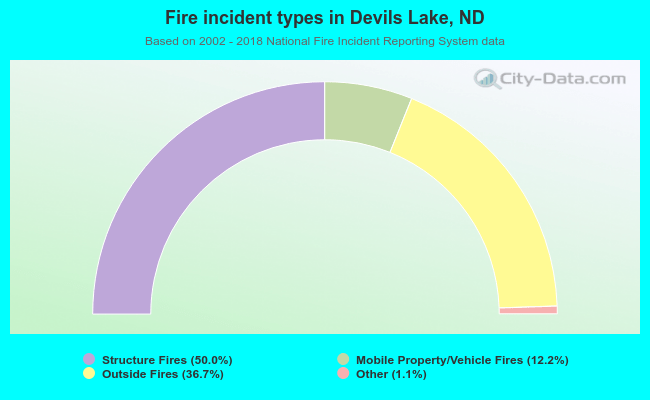 When looking into fire subcategories, the most reports belonged to: Structure Fires (50.0%), and Outside Fires (36.7%).