Rolette: Fire Incidents, North Dakota (ND)
Where are fire incidents reported in Rolette, ND
Something went wrong! Please refresh the page.
|
| |||||||||||||||||||||||||||||||||||||||||||||||||||||||||||||||||||||||||||||||||||||||||||||||||||||||||||||
| Other | 378 | |||||||||||||||||||||||||||||||||||||||||||||||||||||||||||||||||||||||||||||||||||||||||||||||||||||||||||||
2002 - 2017 National Fire Incident Reporting System (NFIRS) incidents
- Incident types reported to NFIRS in Rolette, ND
- 66082.5%Fire
- 465.8%Rescue & EMS
- 445.5%Hazardous Condition
- 222.8%Good Intent Call
- 111.4%Service Call
- 91.1%Special Incident
- 81.0%False Alarm
- Fire incident types reported to NFIRS in Rolette, ND
- 49875.5%Outside Fires
- 8212.4%Mobile Property/Vehicle Fires
- 7210.9%Structure Fires
- 81.2%Other
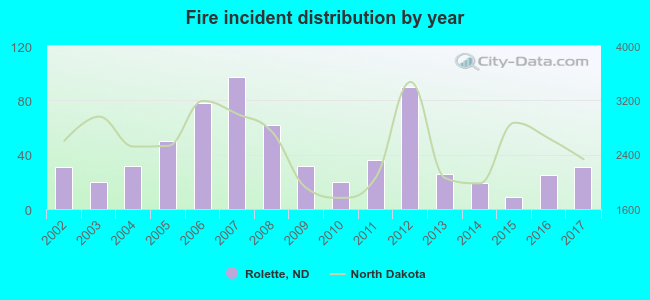 Based on the data from the years 2002 - 2017 the average number of fire incidents per year is 41. The highest number of fire incidents - 97 took place in 2007, and the least - 9 in 2015. The data has a constant trend.
 The median response time based on all reported fire incidents is 8 minutes. This is about the same as the state median value.
The median response time in Rolette, ND compared to nearest cities:
(Note: Based on data for all years, including only cities with at least 500 fire incidents)
| Rolette: | 8 minutes |
| Devils Lake: | 4 minutes |
 24.1% incidents where reported in the morning and 75.9% in the evening. The most fires (18.6%) took place on Monday, and the least (10.3%) on Sunday.
 According to the 660 incident reports from years 2002 - 2017 most fires (22.6%) took place during April, and the least (1.5%) in December.
 Out of all 800 cases reported during the years 2002 - 2017, the most belonged to the categories: Fire (82.5%), Overpressure Rupture (5.8%), and Rescue & EMS (5.5%).
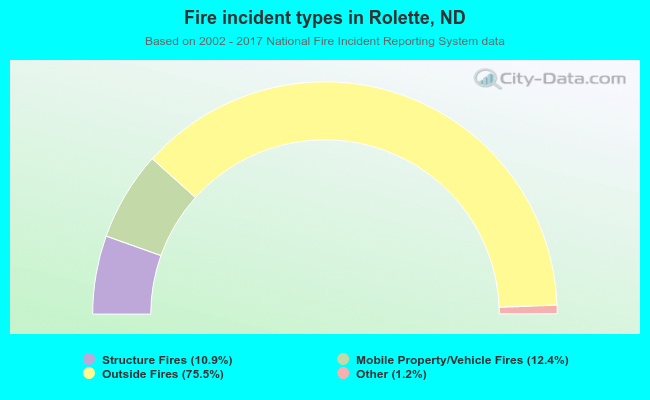 When looking into fire subcategories, the most reports belonged to: Outside Fires (75.5%), and Mobile Property/Vehicle Fires (12.4%).