Dexter: Fire Incidents, Missouri (MO)
Where are fire incidents reported in Dexter, MO
Something went wrong! Please refresh the page.
|
| |||||||||||||||||||||||||||||||||||||||||||||||||||||||||||||||||||||||||||||||||||||||||||||||||||||||||||||
| Other | 532 | |||||||||||||||||||||||||||||||||||||||||||||||||||||||||||||||||||||||||||||||||||||||||||||||||||||||||||||
2002 - 2018 National Fire Incident Reporting System (NFIRS) incidents
- Incident types reported to NFIRS in Dexter, MO
- 95651.2%Fire
- 53028.4%Hazardous Condition
- 1146.1%False Alarm
- 1035.5%Service Call
- 965.1%Good Intent Call
- 593.2%Rescue & EMS
- 60.3%Special Incident
- Fire incident types reported to NFIRS in Dexter, MO
- 39641.4%Structure Fires
- 36638.3%Outside Fires
- 18419.2%Mobile Property/Vehicle Fires
- 101.0%Other
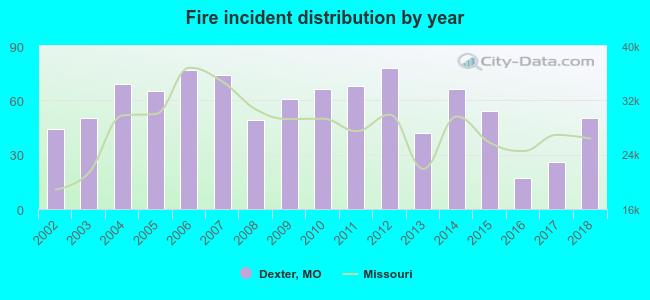 Based on the data from the years 2002 - 2018 the average number of fires per year is 56. The highest number of fires - 78 took place in 2012, and the least - 17 in 2016. The data has a rising trend.
The average number of yearly fire incidents per 10k residents in Dexter, MO compared to nearest cities:
(Note: Based on data for the last 3 years, including only cities with population 5,000 and above)
| Dexter: | 38.9 |
| Sikeston: | 104.9 |
| Poplar Bluff: | 150.6 |
| Charleston: | 9.6 |
| Kennett: | 88.3 |
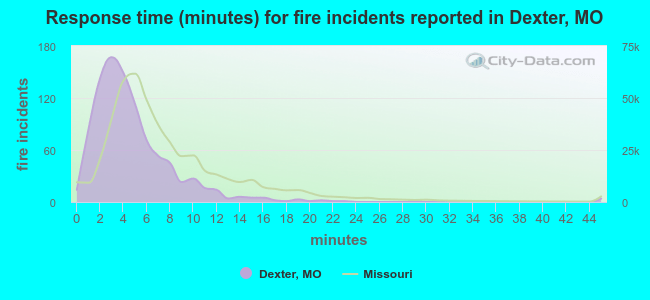 The median response time based on all reported fire incidents is 4 minutes. This is lower compared to the state median value.
The median response time in Dexter, MO compared to nearest cities:
(Note: Based on data for all years, including only cities with at least 500 fire incidents)
| Dexter: | 4 minutes |
| Malden: | 4 minutes |
| Sikeston: | 5 minutes |
| Poplar Bluff: | 5 minutes |
| Portageville: | 9 minutes |
| Kennett: | 3 minutes |
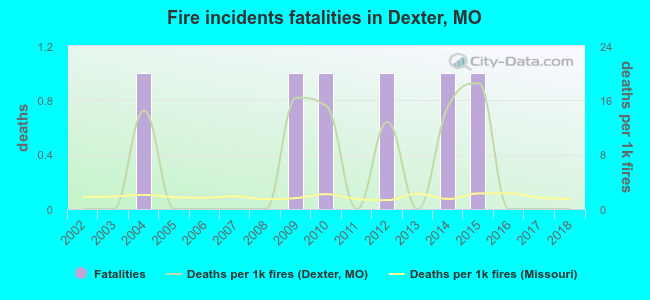 According to the data from the years 2002 - 2018 the average number of fire-related fatalities per year is 0. The highest number of deaths - 1 took place in 2004, and the lowest - 0 in 2002. The data has a constant trend.
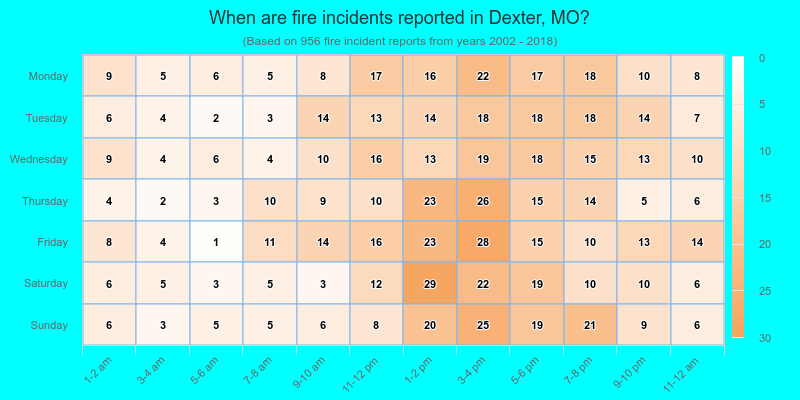
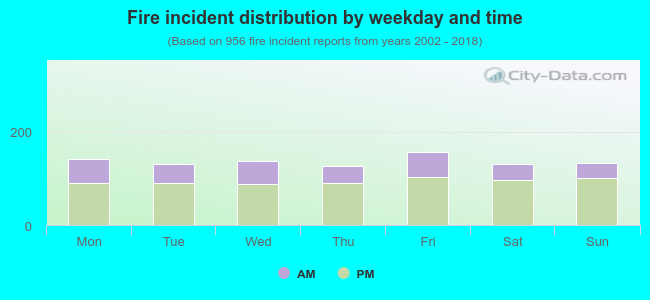 31.4% incidents where reported in the morning and 68.6% in the evening. The most fires (16.4%) took place on Friday, and the least (13.3%) on Thursday.
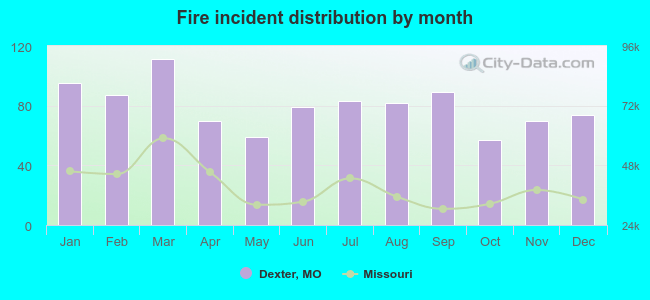 According to the 956 fires from years 2002 - 2018 most fires (11.6%) took place during March, and the least (6.0%) in October.
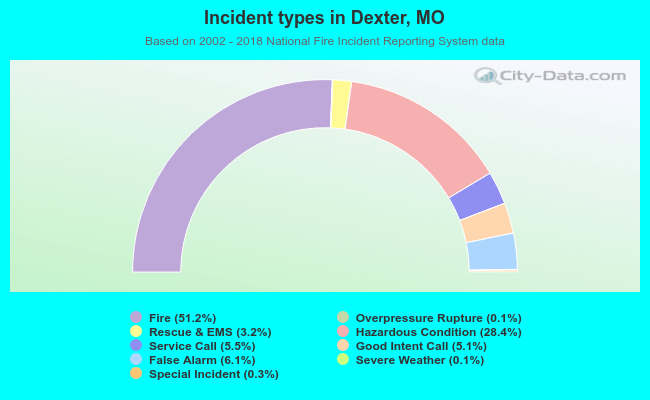 Out of all 1,866 cases reported during the years 2002 - 2018, the most belonged to the categories: Fire (51.2%), Hazardous Condition (28.4%), and False Alarm (6.1%).
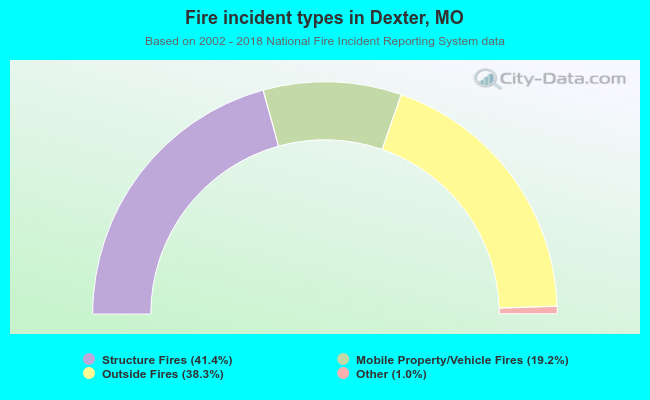 When looking into fire subcategories, the most incidents belonged to: Structure Fires (41.4%), and Outside Fires (38.3%).