Douglasville: Fire Incidents, Georgia (GA)
Where are fire incidents reported in Douglasville, GA
Something went wrong! Please refresh the page.
| Fire incidents reported | |
|---|---|
| Sreet name | Count |
| FAIRBURN RD | 492 |
| HIGHWAY 5 | 298 |
| BANKHEAD HWY | 260 |
| CHAPEL HILL RD | 202 |
| I20 WB FWY | 190 |
| I20 EB FWY | 150 |
| DOUGLAS BLVD | 128 |
| HIGHWAY 166 | 112 |
| HWY 5 | 110 |
| STRICKLAND ST | 110 |
| KINGS HWY | 96 |
| DALLAS HWY | 86 |
| MIDWAY RD | 74 |
| POPE RD | 70 |
| STEWART MILL RD | 68 |
| 5 HWY | 66 |
| HOSPITAL DR | 66 |
| RIDGE RD | 64 |
| CEDAR MOUNTAIN RD | 62 |
| ANNEEWAKEE RD | 56 |
| DORSETT SHOALS RD | 56 |
| BRIGHT STAR RD | 54 |
| CENTRAL CHURCH RD | 54 |
| FLAT ROCK RD | 54 |
| YEAGER RD | 54 |
| BROWN ST | 52 |
| DURELEE LN | 52 |
| BURNT HICKORY RD | 50 |
| CORN CRIB LOOP | 50 |
| WBI20 | 50 |
| Other | 1,718 |
2002 - 2018 National Fire Incident Reporting System (NFIRS) incidents
- Incident types reported to NFIRS in Douglasville, GA
- 33,73859.3%Rescue & EMS
- 7,14812.6%Service Call
- 5,0048.8%Fire
- 4,0297.1%Hazardous Condition
- 3,8856.8%Good Intent Call
- 2,7824.9%False Alarm
- 1350.2%Special Incident
- 840.1%Severe Weather
- 640.1%Overpressure Rupture
- Fire incident types reported to NFIRS in Douglasville, GA
- 2,25745.1%Outside Fires
- 1,61832.3%Structure Fires
- 1,01720.3%Mobile Property/Vehicle Fires
- 1122.2%Other
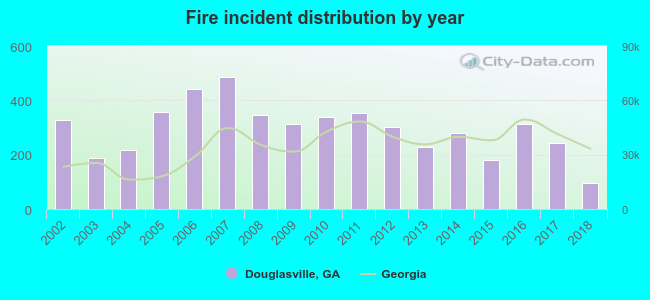 According to the data from the years 2002 - 2018 the average number of fire incidents per year is 294. The highest number of reported fire incidents - 486 took place in 2007, and the least - 94 in 2018. The data has a dropping trend.
The average number of yearly fire incidents per 10k residents in Douglasville, GA compared to nearest cities:
(Note: Based on data for the last 3 years, including only cities with population 5,000 and above)
| Douglasville: | 66.4 |
| Lithia Springs: | 44.3 |
| Austell: | 196.1 |
| Winston: | 27.5 |
| Powder Springs: | 65.1 |
| Mableton: | 20.4 |
| Villa Rica: | 115.0 |
| Dallas: | 203.0 |
| Smyrna: | 30.3 |
 The median response time based on all reported fire incidents is 6 minutes. This is comparable to the state median value.
The median response time in Douglasville, GA compared to nearest cities:
(Note: Based on data for all years, including only cities with at least 500 fire incidents)
| Douglasville: | 6 minutes |
| Lithia Springs: | 7 minutes |
| Austell: | 5 minutes |
| Winston: | 7 minutes |
| Powder Springs: | 6 minutes |
| Hiram: | 7 minutes |
| Mableton: | 6 minutes |
| Villa Rica: | 7 minutes |
| Dallas: | 7 minutes |
 Based on the data from the years 2002 - 2018 the average number of fire-related yearly casualties is 2. The highest number of reported casualties - 6 took place in 2015, and the lowest - 0 in 2011. The data has a decreasing trend.
The average number of injuries per 1,000 fires is 8. This indicator was the highest - 33 in 2015, and the lowest 0 in 2011. The trend for casualties per 1,000 fires is decreasing. Compared to the Georgia value the number of injuries per 1,000 incidents is lower.
Based on the data from the years 2002 - 2018 the average number of fire-related yearly casualties is 2. The highest number of reported casualties - 6 took place in 2015, and the lowest - 0 in 2011. The data has a decreasing trend.
The average number of injuries per 1,000 fires is 8. This indicator was the highest - 33 in 2015, and the lowest 0 in 2011. The trend for casualties per 1,000 fires is decreasing. Compared to the Georgia value the number of injuries per 1,000 incidents is lower.Casualties per 1,000 incidents in Douglasville, GA compared to nearest cities:
(Note: Based on data for all years, including only cities with at least 500 fire incidents)
| Douglasville: | 7.2 |
| Lithia Springs: | 4.0 |
| Austell: | 19.8 |
| Winston: | 0.0 |
| Powder Springs: | 14.3 |
| Hiram: | 4.2 |
| Mableton: | 18.8 |
| Villa Rica: | 14.6 |
| Dallas: | 9.8 |
 25.5% incidents where reported in the morning and 74.5% in the evening. The most fires (16.3%) took place on Saturday, and the least (13.1%) on Wednesday.
 According to the 5,004 fire incidents from years 2002 - 2018 most fires (12.8%) took place during March, and the least (6.0%) in September.
 Out of all 56,869 cases reported during the years 2002 - 2018, the most belonged to the categories: Rescue & EMS (59.3%), Service Call (12.6%), and Fire (8.8%).
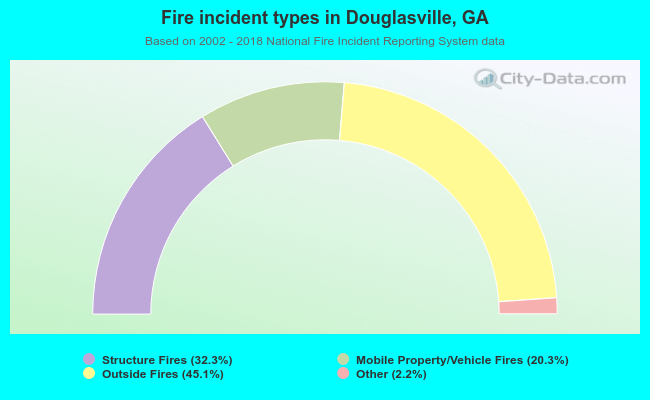 When looking into fire subcategories, the most reports belonged to: Outside Fires (45.1%), and Structure Fires (32.3%).