Lithia Springs: Fire Incidents, Georgia (GA)
Where are fire incidents reported in Lithia Springs, GA
Something went wrong! Please refresh the page.
| Fire incidents reported | |
|---|---|
| Sreet name | Count |
| THORNTON RD | 348 |
| I20 WB FWY | 136 |
| BANKHEAD HWY | 132 |
| LEE RD | 108 |
| SKYVIEW DR | 100 |
| COUNTY LINE RD | 86 |
| MT VERNON RD | 84 |
| SWEETWATER RD | 78 |
| I20 EB FWY | 66 |
| MCKOWN RD | 58 |
| BLAIRS BRIDGE RD | 54 |
| CRESTMARK BLVD | 48 |
| WATERFORD CLUB DR | 42 |
| CROSSINGS DR | 34 |
| BEN HILL RD | 32 |
| RIVERSIDE PKY | 30 |
| COLUMNS DR | 28 |
| LONDON WAY | 28 |
| WB20 | 28 |
| I-20 EXPY | 26 |
| FACTORY SHOALS RD | 24 |
| DOUGLAS HILL RD | 22 |
| TEMPLE ST | 22 |
| ARTHUR DR | 20 |
| BOB ARNOLD BLVD | 20 |
| EB20 | 20 |
| FLORENCE DR | 20 |
| SIX FLAGS RD | 20 |
| BRODICK LN | 18 |
| CHESTNUT LOG DR | 18 |
2002 - 2018 National Fire Incident Reporting System (NFIRS) incidents
- Incident types reported to NFIRS in Lithia Springs, GA
- 8,46159.4%Rescue & EMS
- 1,50610.6%Fire
- 1,4169.9%Service Call
- 9816.9%Good Intent Call
- 9596.7%False Alarm
- 8846.2%Hazardous Condition
- 230.2%Overpressure Rupture
- 180.1%Special Incident
- Fire incident types reported to NFIRS in Lithia Springs, GA
- 62941.8%Outside Fires
- 43629.0%Mobile Property/Vehicle Fires
- 41627.6%Structure Fires
- 251.7%Other
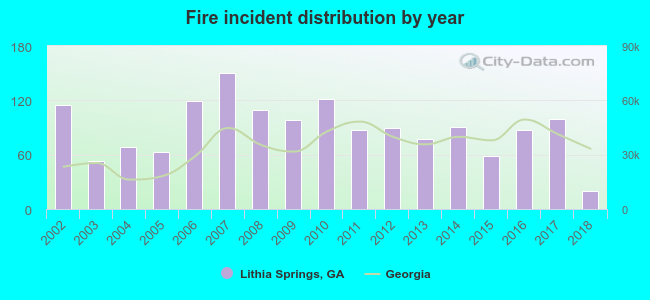 Based on the data from the years 2002 - 2018 the average number of fire incidents per year is 89. The highest number of reported fires - 150 took place in 2007, and the least - 20 in 2018. The data has a declining trend.
The average number of yearly fire incidents per 10k residents in Lithia Springs, GA compared to nearest cities:
(Note: Based on data for the last 3 years, including only cities with population 5,000 and above)
| Lithia Springs: | 44.3 |
| Austell: | 196.1 |
| Powder Springs: | 65.1 |
| Mableton: | 20.4 |
| Douglasville: | 66.4 |
| Smyrna: | 30.3 |
| Winston: | 27.5 |
| Marietta: | 90.3 |
| Dallas: | 203.0 |
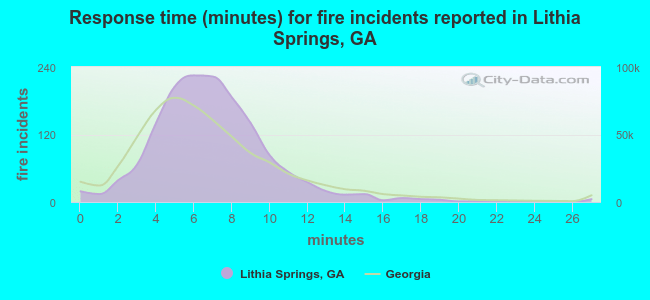 The median response time based on all reported fire incidents is 7 minutes. This is similar to the state median value.
The median response time in Lithia Springs, GA compared to nearest cities:
(Note: Based on data for all years, including only cities with at least 500 fire incidents)
| Lithia Springs: | 7 minutes |
| Austell: | 5 minutes |
| Powder Springs: | 6 minutes |
| Mableton: | 6 minutes |
| Douglasville: | 6 minutes |
| Hiram: | 7 minutes |
| Smyrna: | 5 minutes |
| Winston: | 7 minutes |
| Marietta: | 6 minutes |
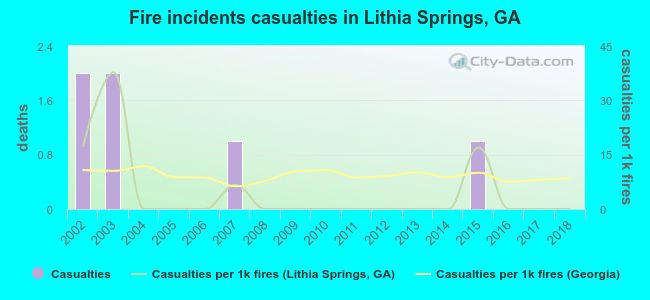 According to the data from the years 2002 - 2018 the average number of fire-related casualties per year is 0. The highest number of reported injuries - 2 took place in 2002, and the lowest - 0 in 2004. The data has a decreasing trend.
The average number of casualties per 1,000 fires is 5. This indicator was the highest - 38 in 2003, and the lowest 0 in 2004. The trend for injuries per 1,000 fires is declining. Compared to the state value the number of casualties per 1,000 incidents is much lower.
According to the data from the years 2002 - 2018 the average number of fire-related casualties per year is 0. The highest number of reported injuries - 2 took place in 2002, and the lowest - 0 in 2004. The data has a decreasing trend.
The average number of casualties per 1,000 fires is 5. This indicator was the highest - 38 in 2003, and the lowest 0 in 2004. The trend for injuries per 1,000 fires is declining. Compared to the state value the number of casualties per 1,000 incidents is much lower.Casualties per 1,000 incidents in Lithia Springs, GA compared to nearest cities:
(Note: Based on data for all years, including only cities with at least 500 fire incidents)
| Lithia Springs: | 4.0 |
| Austell: | 19.8 |
| Powder Springs: | 14.3 |
| Mableton: | 18.8 |
| Douglasville: | 7.2 |
| Hiram: | 4.2 |
| Smyrna: | 9.5 |
| Winston: | 0.0 |
| Marietta: | 24.8 |
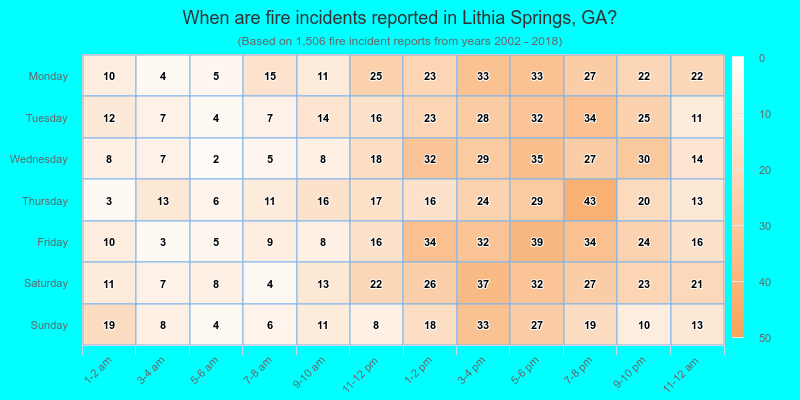
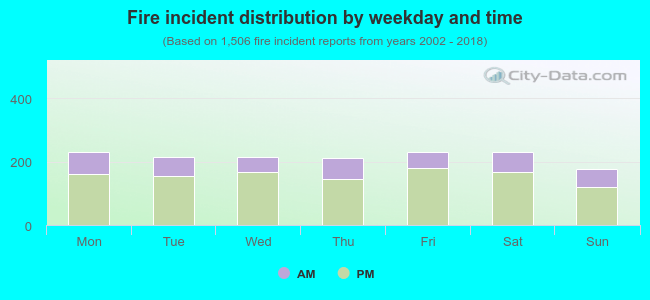 27.6% incidents where reported in the morning and 72.4% in the evening. The most fires (15.3%) took place on Saturday, and the least (11.7%) on Sunday.
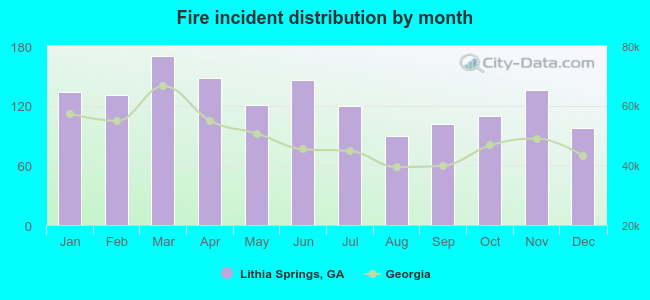 According to the 1,506 reports from years 2002 - 2018 most fires (11.3%) took place during March, and the least (6.0%) in August.
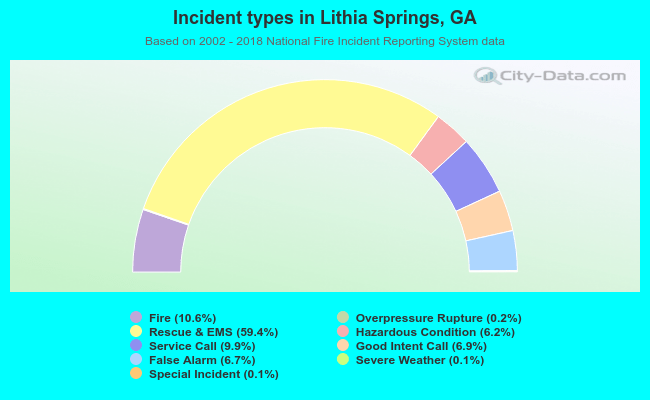 Out of all 14,256 cases reported during the years 2002 - 2018, the most belonged to the categories: Rescue & EMS (59.4%), Fire (10.6%), and Service Call (9.9%).
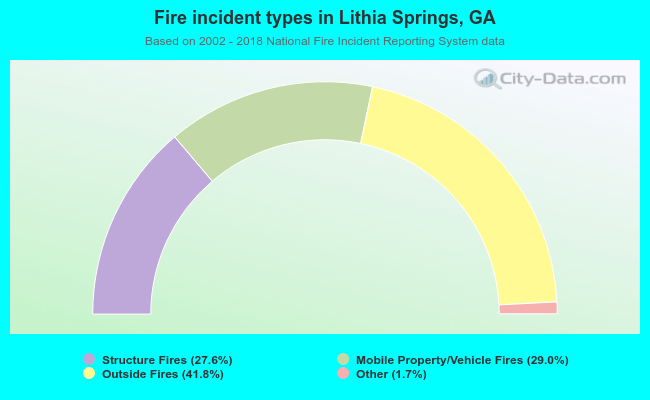 When looking into fire subcategories, the most reports belonged to: Outside Fires (41.8%), and Mobile Property/Vehicle Fires (29.0%).