Drexel Hill: Fire Incidents, Pennsylvania (PA)
Where are fire incidents reported in Drexel Hill, PA
Something went wrong! Please refresh the page.
|
| |||||||||||||||||||||||||||||||||||||||||||||||||||||||||||||||||||||||||||||||||||||||||||||||||||||||||||||
2004 - 2018 National Fire Incident Reporting System (NFIRS) incidents
- Incident types reported to NFIRS in Drexel Hill, PA
- 31827.9%False Alarm
- 31627.7%Hazardous Condition
- 21218.6%Fire
- 1069.3%Good Intent Call
- 928.1%Rescue & EMS
- 696.0%Service Call
- 171.5%Severe Weather
- 80.7%Special Incident
- 30.3%Overpressure Rupture
- Fire incident types reported to NFIRS in Drexel Hill, PA
- 11554.2%Structure Fires
- 7635.8%Outside Fires
- 178.0%Mobile Property/Vehicle Fires
- 41.9%Other
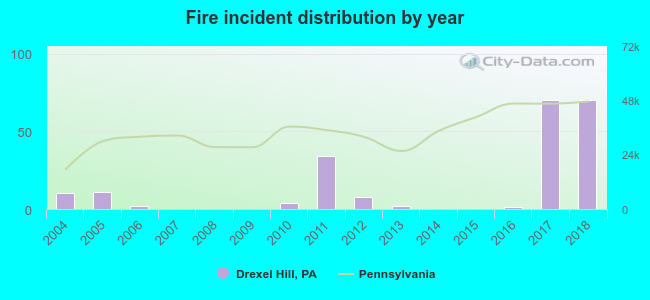 Based on the data from the years 2004 - 2018 the average number of fire incidents per year is 14. The highest number of reported fire incidents - 70 took place in 2017, and the least - 0 in 2007. The data has an increasing trend.
The average number of yearly fire incidents per 10k residents in Drexel Hill, PA compared to nearest cities:
(Note: Based on data for the last 3 years, including only cities with population 5,000 and above)
| Drexel Hill: | 16.8 |
| Clifton Heights: | 46.0 |
| Lansdowne: | 63.3 |
| Springfield: | 14.6 |
| Collingdale: | 61.4 |
| Yeadon: | 98.3 |
| Darby Township: | 6.2 |
| Broomall: | 53.4 |
| Darby: | 116.6 |
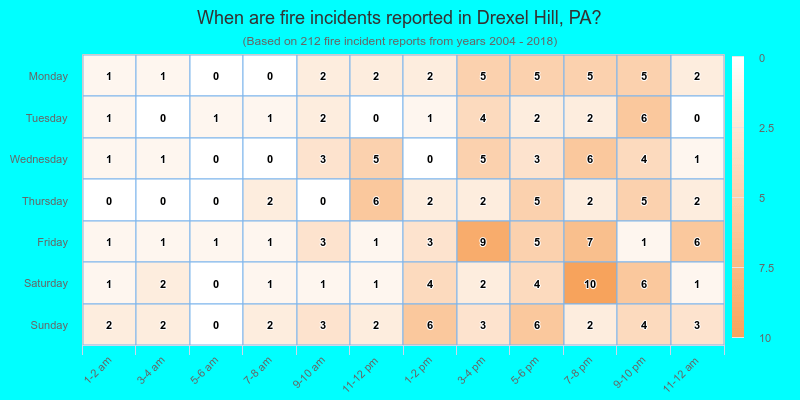
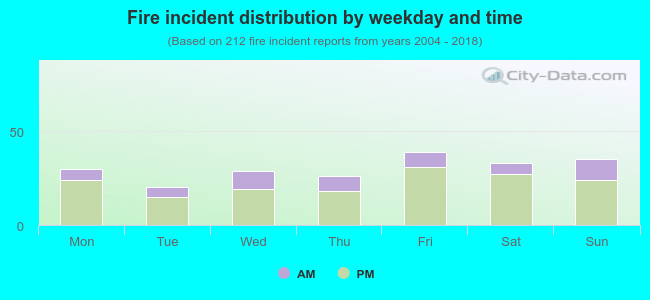 25.5% incidents where reported in the morning and 74.5% in the evening. The most fires (18.4%) took place on Friday, and the least (9.4%) on Tuesday.
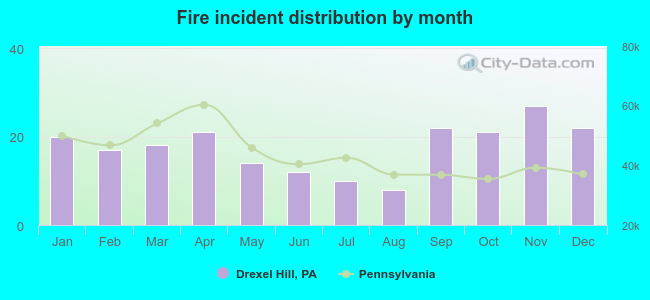 Based on the 212 fire incidents from years 2004 - 2018 most fires (12.7%) took place during November, and the least (3.8%) in August.
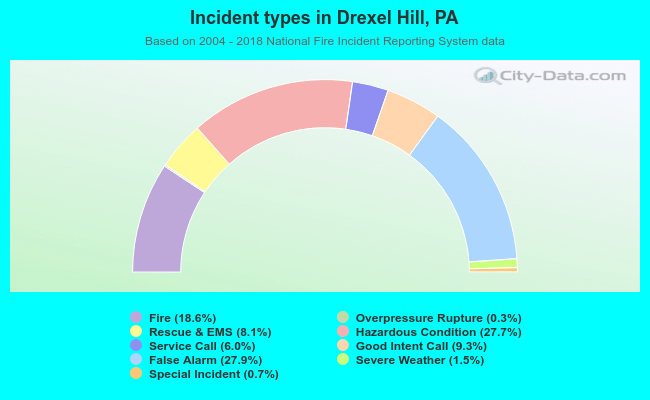 Out of all 1,141 cases reported during the years 2004 - 2018, the most belonged to the categories: False Alarm (27.9%), Hazardous Condition (27.7%), and Fire (18.6%).
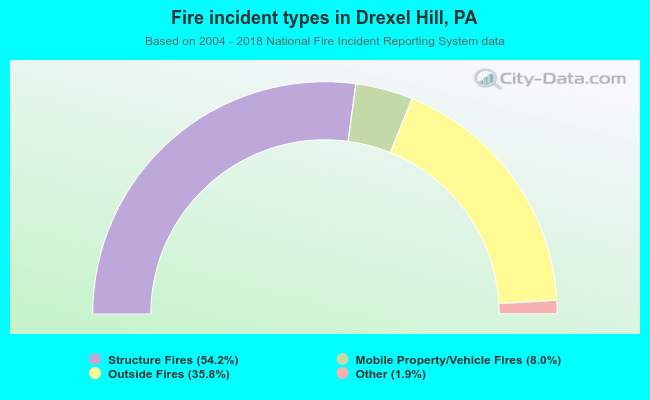 When looking into fire subcategories, the most reports belonged to: Structure Fires (54.2%), and Outside Fires (35.8%).