Yeadon: Fire Incidents, Pennsylvania (PA)
Where are fire incidents reported in Yeadon, PA
Something went wrong! Please refresh the page.
| Fire incidents reported | |
|---|---|
| Sreet name | Count |
| ALFRED DR | 150 |
| LANSDOWNE AVE | 120 |
| CHURCH LN | 102 |
| FRONT ST | 78 |
| WYCOMBE AVE | 54 |
| CHESTER AVE | 52 |
| LONGACRE BLVD | 50 |
| YEADON AVE | 48 |
| BELL AVE | 46 |
| BULLOCK AVE | 46 |
| PATRICIA DR | 46 |
| CYPRESS ST | 44 |
| MACDADE BLVD | 34 |
| PENN ST | 32 |
| FERN ST | 30 |
| SERRILL AVE | 30 |
| BAILEY RD | 28 |
| BALTIMORE PIKE | 26 |
| LINCOLN AVE | 26 |
| WHITBY AVE | 26 |
| PROVIDENCE RD | 24 |
| BALTIMORE AVE | 22 |
| COBBS CREEK PARKWAY PKY | 22 |
| LAUREL RD | 22 |
| ANGORA DR | 20 |
| HOLLY RD | 18 |
| ALFRED AVE | 16 |
| COMMERCE DR | 16 |
| ELDER AVE | 16 |
| ANGORA AVE | 14 |
2006 - 2018 National Fire Incident Reporting System (NFIRS) incidents
- Incident types reported to NFIRS in Yeadon, PA
- 84747.1%Fire
- 33818.8%Hazardous Condition
- 28115.6%Good Intent Call
- 1287.1%Rescue & EMS
- 1106.1%False Alarm
- 573.2%Special Incident
- 362.0%Service Call
- Fire incident types reported to NFIRS in Yeadon, PA
- 48256.9%Structure Fires
- 25430.0%Other
- 607.1%Outside Fires
- 516.0%Mobile Property/Vehicle Fires
 According to the data from the years 2006 - 2018 the average number of fires per year is 65. The highest number of fires - 194 took place in 2017, and the least - 0 in 2010. The data has a decreasing trend.
The average number of yearly fire incidents per 10k residents in Yeadon, PA compared to nearest cities:
(Note: Based on data for the last 3 years, including only cities with population 5,000 and above)
| Yeadon: | 98.3 |
| Darby: | 116.6 |
| Lansdowne: | 63.3 |
| Collingdale: | 61.4 |
| Sharon Hill: | 129.7 |
| Clifton Heights: | 46.0 |
| Darby Township: | 6.2 |
| Drexel Hill: | 16.8 |
| Folcroft: | 66.3 |
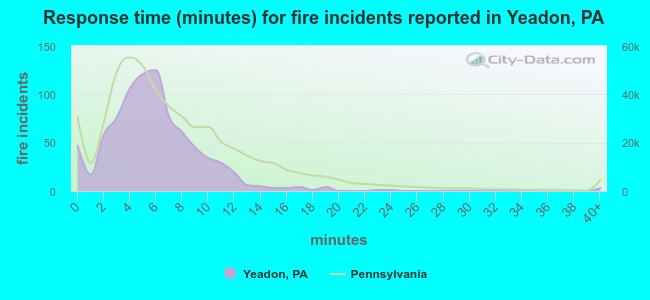 The median response time based on all reported fire incidents is 5 minutes. This is lower than the state median value.
The median response time in Yeadon, PA compared to nearest cities:
(Note: Based on data for all years, including only cities with at least 500 fire incidents)
| Yeadon: | 5 minutes |
| Darby: | 5 minutes |
| Collingdale: | 4 minutes |
| Broomall: | 6 minutes |
| Paulsboro: | 8 minutes |
| Philadelphia: | 4 minutes |
| Media: | 6 minutes |
| Gloucester City: | 4 minutes |
| Camden: | 4 minutes |
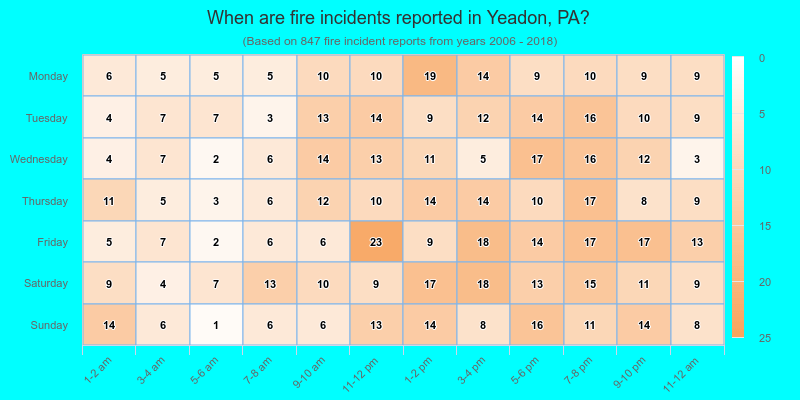
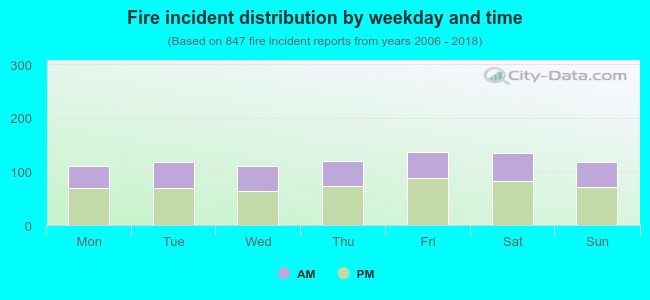 38.8% incidents where reported in the morning and 61.2% in the evening. The most fires (16.2%) took place on Friday, and the least (13.0%) on Wednesday.
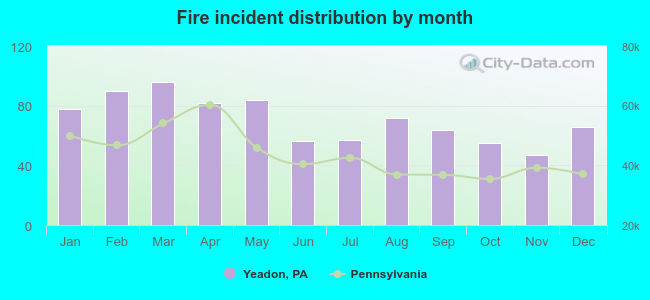 Based on the 847 fire incidents from years 2006 - 2018 most fires (11.3%) took place during March, and the least (5.5%) in November.
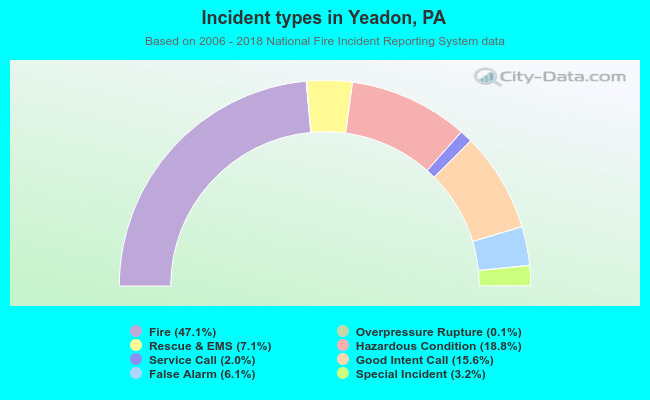 Out of all 1,798 cases reported during the years 2006 - 2018, the most belonged to the categories: Fire (47.1%), Hazardous Condition (18.8%), and Good Intent Call (15.6%).
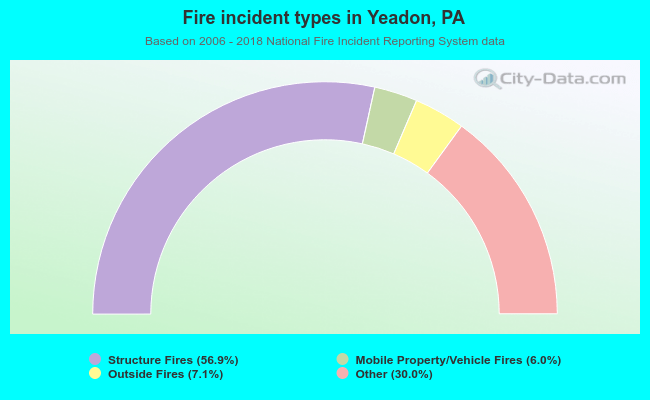 When looking into fire subcategories, the most incidents belonged to: Structure Fires (56.9%), and Other (30.0%).