Dublin: Fire Incidents, Georgia (GA)
Where are fire incidents reported in Dublin, GA
Something went wrong! Please refresh the page.
| Fire incidents reported | |
|---|---|
| Sreet name | Count |
| HWY 441 | 198 |
| HWY 19 | 114 |
| I-16 EXPY | 98 |
| I16 EXPY | 90 |
| SCOTLAND RD | 70 |
| HWY 257 | 60 |
| JEFFERSON ST | 58 |
| VETERANS BLVD | 56 |
| PINEHILL RD | 54 |
| HIGHWAY 441 | 50 |
| MT OLIVE RD | 50 |
| OLD HAWKINSVILLE RD | 50 |
| WALKE DAIRY RD | 48 |
| CLAXTON DAIRY RD | 44 |
| OLD TOOMSBORO RD | 44 |
| GREG COUEY RD | 40 |
| HWY 46 | 40 |
| MCCLENDON RD | 38 |
| MOORE STATION RD | 38 |
| SOUTHERN PINES RD | 38 |
| BLACKSHEAR FERRY RD | 36 |
| HWY 80 | 36 |
| EVERGREEN RD | 34 |
| OLD MACON RD | 34 |
| VALAMBROSIA RD | 34 |
| HALL RD | 32 |
| LAUREN WOODS RD | 32 |
| MAYBERRY RD | 32 |
| POPLAR SPRINGS CHURCH RD | 32 |
| TELFAIR ST | 32 |
| Other | 603 |
2002 - 2018 National Fire Incident Reporting System (NFIRS) incidents
- Incident types reported to NFIRS in Dublin, GA
- 3,86833.4%Rescue & EMS
- 2,31420.0%Good Intent Call
- 2,21519.1%Fire
- 1,80815.6%Hazardous Condition
- 7136.1%Service Call
- 6075.2%False Alarm
- 320.3%Severe Weather
- 290.3%Special Incident
- Fire incident types reported to NFIRS in Dublin, GA
- 1,20054.2%Outside Fires
- 59727.0%Structure Fires
- 35816.2%Mobile Property/Vehicle Fires
- 602.7%Other
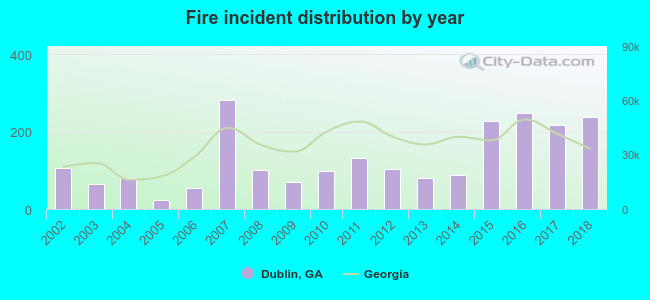 Based on the data from the years 2002 - 2018 the average number of fire incidents per year is 130. The highest number of reported fire incidents - 281 took place in 2007, and the least - 22 in 2005. The data has an increasing trend.
The average number of yearly fire incidents per 10k residents in Dublin, GA compared to nearest cities:
(Note: Based on data for the last 3 years, including only cities with population 5,000 and above)
| Dublin: | 145.0 |
| Eastman: | 244.5 |
| Sandersville: | 128.6 |
| McRae: | 11.2 |
| Swainsboro: | 191.8 |
| Hawkinsville: | 147.1 |
| Vidalia: | 35.9 |
| Warner Robins: | 45.5 |
| Milledgeville: | 136.4 |
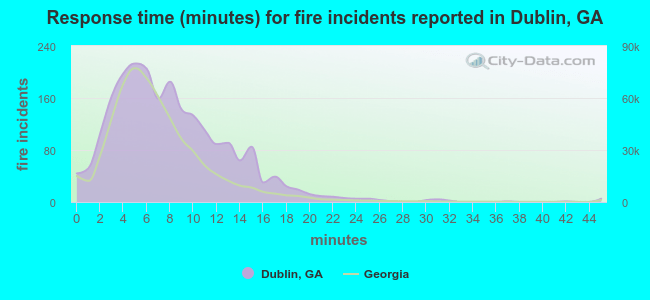 The median response time based on all reported fire incidents is 7 minutes. This is comparable to the Georgia median value.
The median response time in Dublin, GA compared to nearest cities:
(Note: Based on data for all years, including only cities with at least 500 fire incidents)
| Dublin: | 7 minutes |
| East Dublin: | 7 minutes |
| Wrightsville: | 10 minutes |
| Cochran: | 7 minutes |
| Eastman: | 6 minutes |
| Sandersville: | 4 minutes |
| McRae: | 6 minutes |
| Swainsboro: | 8 minutes |
| Hawkinsville: | 7 minutes |
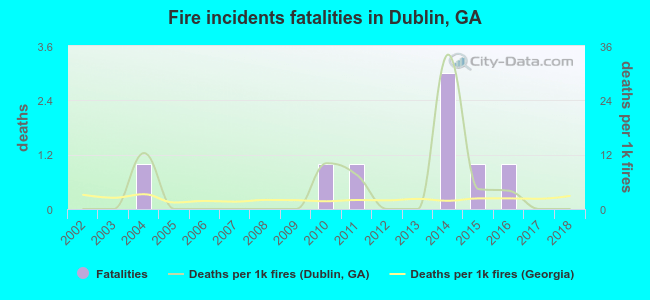 According to the data from the years 2002 - 2018 the average number of fire-related fatalities per year is 0. The highest number of reported deaths - 3 took place in 2014, and the lowest - 0 in 2002. The data has a constant trend.
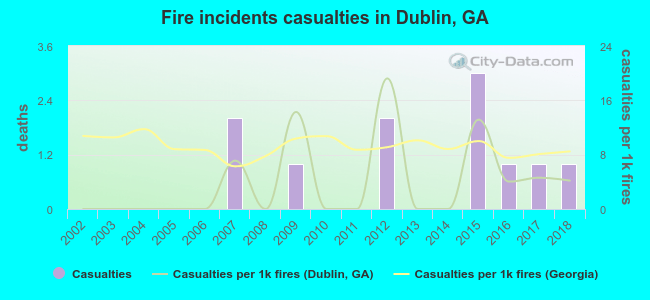 According to the data from the years 2002 - 2018 the average number of fire-related yearly casualties is 1. The highest number of reported casualties - 3 took place in 2015, and the lowest - 0 in 2002. The data has an increasing trend.
The average number of casualties per 1,000 fire incidents is 4. This indicator was the highest - 19 in 2012, and the lowest 0 in 2002. The trend for injuries per 1,000 incidents is rising. Compared to the state value the number of casualties per 1,000 fires is lower.
According to the data from the years 2002 - 2018 the average number of fire-related yearly casualties is 1. The highest number of reported casualties - 3 took place in 2015, and the lowest - 0 in 2002. The data has an increasing trend.
The average number of casualties per 1,000 fire incidents is 4. This indicator was the highest - 19 in 2012, and the lowest 0 in 2002. The trend for injuries per 1,000 incidents is rising. Compared to the state value the number of casualties per 1,000 fires is lower.Casualties per 1,000 incidents in Dublin, GA compared to nearest cities:
(Note: Based on data for all years, including only cities with at least 500 fire incidents)
| Dublin: | 5.0 |
| East Dublin: | 6.5 |
| Wrightsville: | 3.8 |
| Cochran: | 5.6 |
| Eastman: | 1.4 |
| Sandersville: | 4.4 |
| McRae: | 5.2 |
| Swainsboro: | 0.0 |
| Hawkinsville: | 4.8 |
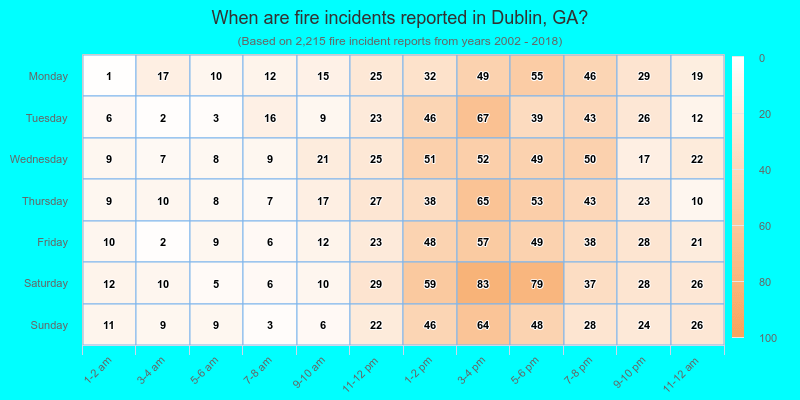
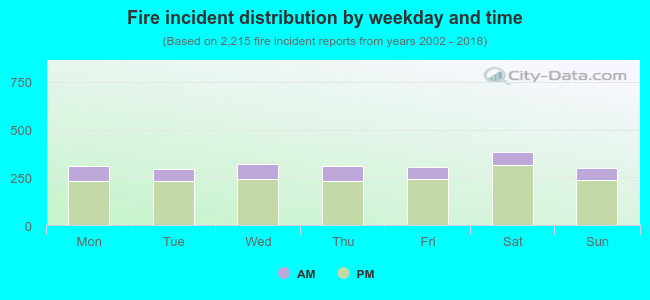 22.1% incidents where reported in the morning and 77.9% in the evening. The most fires (17.3%) took place on Saturday, and the least (13.2%) on Tuesday.
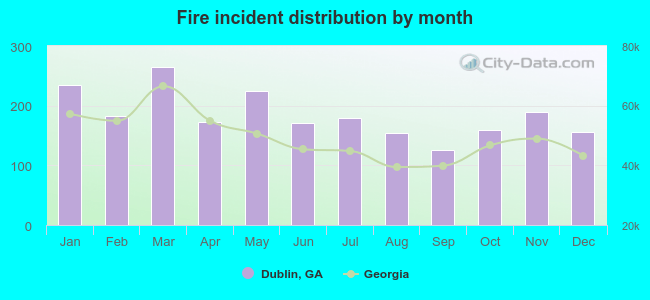 Based on the 2,215 fire incident reports from years 2002 - 2018 most fires (11.9%) took place during March, and the least (5.7%) in September.
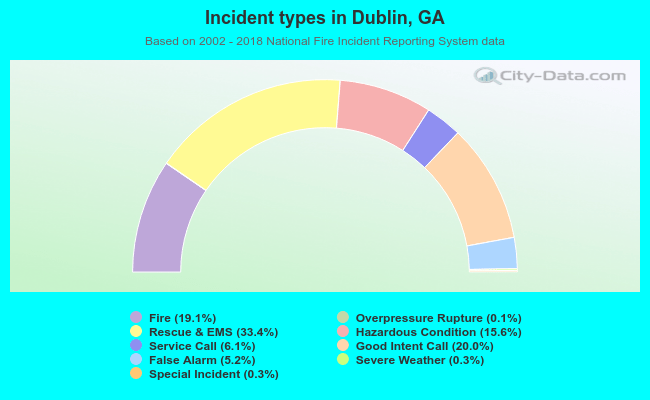 Out of all 11,594 cases reported during the years 2002 - 2018, the most belonged to the categories: Rescue & EMS (33.4%), Good Intent Call (20.0%), and Fire (19.1%).
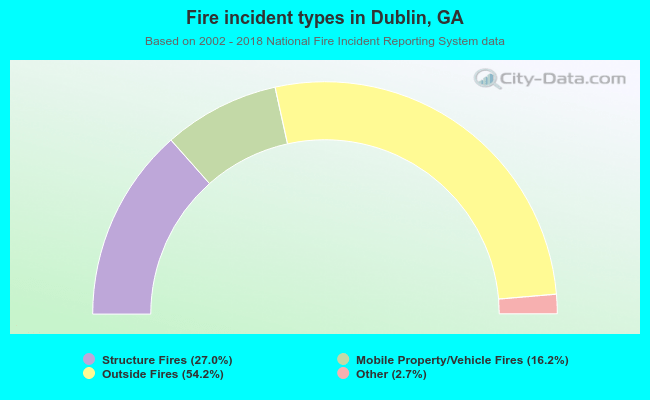 When looking into fire subcategories, the most incidents belonged to: Outside Fires (54.2%), and Structure Fires (27.0%).