Hawkinsville: Fire Incidents, Georgia (GA)
Where are fire incidents reported in Hawkinsville, GA
Something went wrong! Please refresh the page.
|
| |||||||||||||||||||||||||||||||||||||||||||||||||||||||||||||||||||||||||||||||||||||||||||||||||||||||||||||
| Other | 59 | |||||||||||||||||||||||||||||||||||||||||||||||||||||||||||||||||||||||||||||||||||||||||||||||||||||||||||||
2003 - 2018 National Fire Incident Reporting System (NFIRS) incidents
- Incident types reported to NFIRS in Hawkinsville, GA
- 61936.8%Fire
- 31718.8%Rescue & EMS
- 22113.1%Good Intent Call
- 22013.1%Service Call
- 1639.7%Hazardous Condition
- 1096.5%False Alarm
- 171.0%Severe Weather
- 120.7%Overpressure Rupture
- 50.3%Special Incident
- Fire incident types reported to NFIRS in Hawkinsville, GA
- 34455.6%Outside Fires
- 16526.7%Structure Fires
- 10917.6%Mobile Property/Vehicle Fires
- 10.2%Other
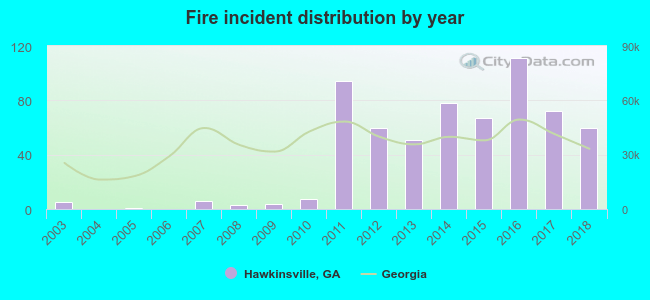 Based on the data from the years 2003 - 2018 the average number of fire incidents per year is 39. The highest number of fires - 111 took place in 2016, and the least - 0 in 2004. The data has a rising trend.
The average number of yearly fire incidents per 10k residents in Hawkinsville, GA compared to nearest cities:
(Note: Based on data for the last 3 years, including only cities with population 5,000 and above)
| Hawkinsville: | 147.1 |
| Eastman: | 244.5 |
| Perry: | 66.9 |
| Warner Robins: | 45.5 |
| Centerville: | 42.2 |
| Cordele: | 179.8 |
| Fort Valley: | 39.1 |
| Dublin: | 145.0 |
| McRae: | 11.2 |
 The median response time based on all reported fire incidents is 7 minutes. This is close to the state median value.
The median response time in Hawkinsville, GA compared to nearest cities:
(Note: Based on data for all years, including only cities with at least 500 fire incidents)
| Hawkinsville: | 7 minutes |
| Cochran: | 7 minutes |
| Unadilla: | 8 minutes |
| Eastman: | 6 minutes |
| Perry: | 7 minutes |
| Warner Robins: | 6 minutes |
| Cordele: | 5 minutes |
| Byron: | 6 minutes |
| Fort Valley: | 4 minutes |
 22.5% incidents where reported in the morning and 77.5% in the evening. The most fires (18.9%) took place on Saturday, and the least (11.8%) on Wednesday.
 Based on the 619 fires from years 2003 - 2018 most fires (10.5%) took place during March, and the least (5.8%) in April.
 Out of all 1,683 cases reported during the years 2003 - 2018, the most belonged to the categories: Fire (36.8%), Rescue & EMS (18.8%), and Good Intent Call (13.1%).
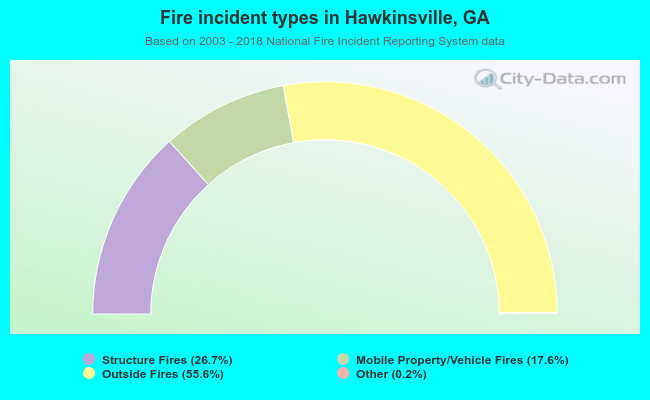 When looking into fire subcategories, the most reports belonged to: Outside Fires (55.6%), and Structure Fires (26.7%).