Dumfries: Fire Incidents, Virginia (VA)
Where are fire incidents reported in Dumfries, VA
Something went wrong! Please refresh the page.
|
| |||||||||||||||||||||||||||||||||||||||||||||||||||||||||||||||||||||||||||||||||||||||||||||||||||||||||||||
2005 - 2018 National Fire Incident Reporting System (NFIRS) incidents
- Incident types reported to NFIRS in Dumfries, VA
- 6,75972.7%Rescue & EMS
- 8058.7%Good Intent Call
- 5866.3%Service Call
- 3573.8%Special Incident
- 3423.7%False Alarm
- 2322.5%Fire
- 2102.3%Hazardous Condition
- Fire incident types reported to NFIRS in Dumfries, VA
- 8436.2%Outside Fires
- 7431.9%Structure Fires
- 4619.8%Other
- 2812.1%Mobile Property/Vehicle Fires
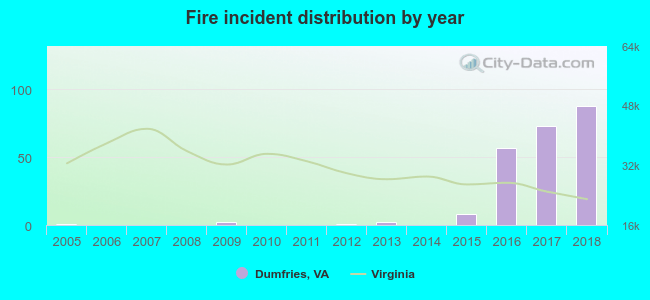 Based on the data from the years 2005 - 2018 the average number of fires per year is 17. The highest number of reported fire incidents - 88 took place in 2018, and the least - 0 in 2006. The data has an increasing trend.
The average number of yearly fire incidents per 10k residents in Dumfries, VA compared to nearest cities:
(Note: Based on data for the last 3 years, including only cities with population 5,000 and above)
| Dumfries: | 140.0 |
| Triangle: | 28.1 |
| Dale City: | 0.3 |
| Lorton: | 44.4 |
| Fort Belvoir: | 8.5 |
| Burke: | 11.0 |
| Manassas: | 101.6 |
| Manassas Park: | 17.4 |
| West Springfield: | 11.6 |

 28.9% incidents where reported in the morning and 71.1% in the evening. The most fires (18.1%) took place on Thursday, and the least (11.2%) on Saturday.
 According to the 232 fire incident reports from years 2005 - 2018 most fires (13.4%) took place during April, and the least (3.9%) in September.
 Out of all 9,294 cases reported during the years 2005 - 2018, the most belonged to the categories: Rescue & EMS (72.7%), Good Intent Call (8.7%), and Service Call (6.3%).
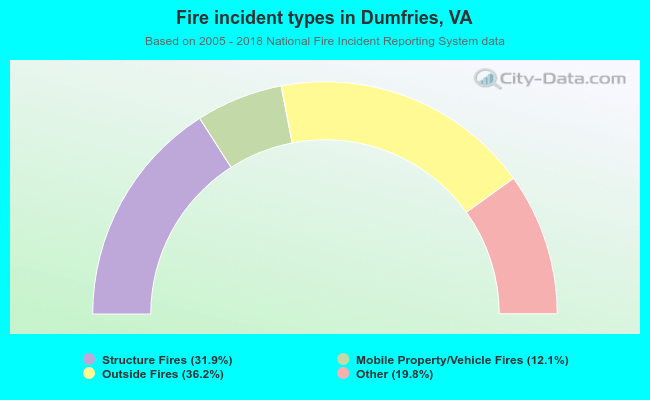 When looking into fire subcategories, the most incidents belonged to: Outside Fires (36.2%), and Structure Fires (31.9%).