Duncanville: Fire Incidents, Texas (TX)
Where are fire incidents reported in Duncanville, TX
Something went wrong! Please refresh the page.
| Fire incidents reported | |
|---|---|
| Sreet name | Count |
| HWY 67 | 162 |
| CAMP WISDOM RD | 146 |
| I20 | 118 |
| COCKRELL HILL RD | 116 |
| CENTER ST | 102 |
| MAIN ST | 96 |
| IH 20 | 90 |
| WHEATLAND RD | 84 |
| CAMP WISDOM RD | 82 |
| MERRILL AVE | 72 |
| CEDAR RIDGE DR | 70 |
| LINK DR | 70 |
| CENTER ST | 58 |
| COCKRELL HILL RD | 48 |
| WHEATLAND RD | 48 |
| CLARK RD | 46 |
| BIG STONE GAP | 40 |
| CEDAR RIDGE DR | 40 |
| MAIN ST | 40 |
| ACTON AVE | 38 |
| ALEXANDER AVE | 38 |
| RED BIRD LN | 34 |
| 67 SR HWY | 32 |
| MERRILL AV | 32 |
| GABLE AVE | 30 |
| GAYNOR AVE | 30 |
| JELLISON BLVD | 30 |
| ALEXANDER AV | 28 |
| ACTON AV | 26 |
| BLUERIDGE DR | 24 |
| Other | 692 |
2003 - 2018 National Fire Incident Reporting System (NFIRS) incidents
- Incident types reported to NFIRS in Duncanville, TX
- 16,79757.1%Rescue & EMS
- 3,83113.0%Good Intent Call
- 2,5628.7%Fire
- 2,4498.3%Hazardous Condition
- 2,3688.1%Service Call
- 1,3044.4%False Alarm
- 630.2%Special Incident
- 300.1%Overpressure Rupture
- Fire incident types reported to NFIRS in Duncanville, TX
- 1,23748.3%Structure Fires
- 74829.2%Outside Fires
- 42616.6%Mobile Property/Vehicle Fires
- 1515.9%Other
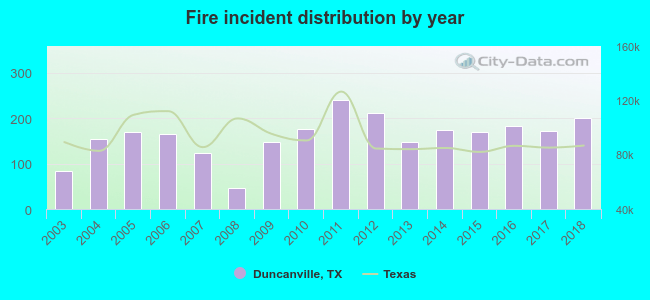 Based on the data from the years 2003 - 2018 the average number of fire incidents per year is 160. The highest number of fires - 239 took place in 2011, and the least - 47 in 2008. The data has a growing trend.
The average number of yearly fire incidents per 10k residents in Duncanville, TX compared to nearest cities:
(Note: Based on data for the last 3 years, including only cities with population 5,000 and above)
| Duncanville: | 46.6 |
| DeSoto: | 30.4 |
| Cedar Hill: | 34.2 |
| Glenn Heights: | 40.3 |
| Grand Prairie: | 27.7 |
| Lancaster: | 43.2 |
| Red Oak: | 70.4 |
| Hutchins: | 76.1 |
| Midlothian: | 68.0 |
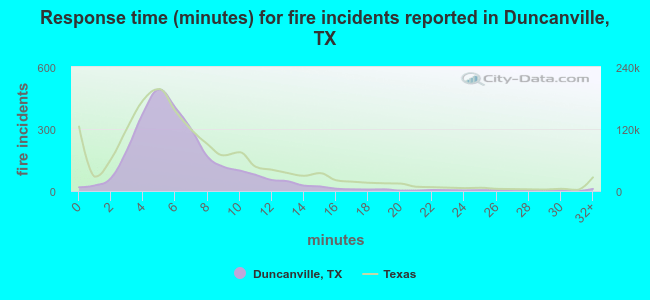 The median response time based on all reported fire incidents is 6 minutes. This is comparable to the state median value.
The median response time in Duncanville, TX compared to nearest cities:
(Note: Based on data for all years, including only cities with at least 500 fire incidents)
| Duncanville: | 6 minutes |
| DeSoto: | 6 minutes |
| Cedar Hill: | 6 minutes |
| Glenn Heights: | 5 minutes |
| Grand Prairie: | 7 minutes |
| Lancaster: | 6 minutes |
| Red Oak: | 6 minutes |
| Hutchins: | 6 minutes |
| Midlothian: | 8 minutes |
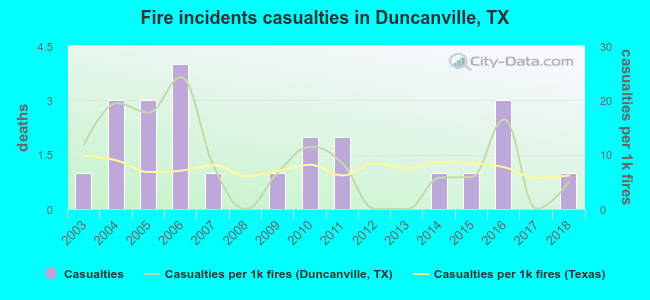 According to the reports from the years 2003 - 2018 the average number of fire-related yearly casualties is 1. The highest number of casualties - 4 took place in 2006, and the lowest - 0 in 2008. The data has a constant trend.
The average number of casualties per 1,000 fires is 9. This indicator was the highest - 24 in 2006, and the lowest 0 in 2008. The trend for casualties per 1,000 fire incidents is decreasing. Compared to the state value the number of casualties per 1,000 fire incidents is similar.
According to the reports from the years 2003 - 2018 the average number of fire-related yearly casualties is 1. The highest number of casualties - 4 took place in 2006, and the lowest - 0 in 2008. The data has a constant trend.
The average number of casualties per 1,000 fires is 9. This indicator was the highest - 24 in 2006, and the lowest 0 in 2008. The trend for casualties per 1,000 fire incidents is decreasing. Compared to the state value the number of casualties per 1,000 fire incidents is similar.Casualties per 1,000 incidents in Duncanville, TX compared to nearest cities:
(Note: Based on data for all years, including only cities with at least 500 fire incidents)
| Duncanville: | 9.0 |
| DeSoto: | 15.3 |
| Cedar Hill: | 13.7 |
| Glenn Heights: | 13.0 |
| Grand Prairie: | 20.4 |
| Lancaster: | 15.5 |
| Red Oak: | 5.3 |
| Hutchins: | 9.0 |
| Midlothian: | 12.3 |
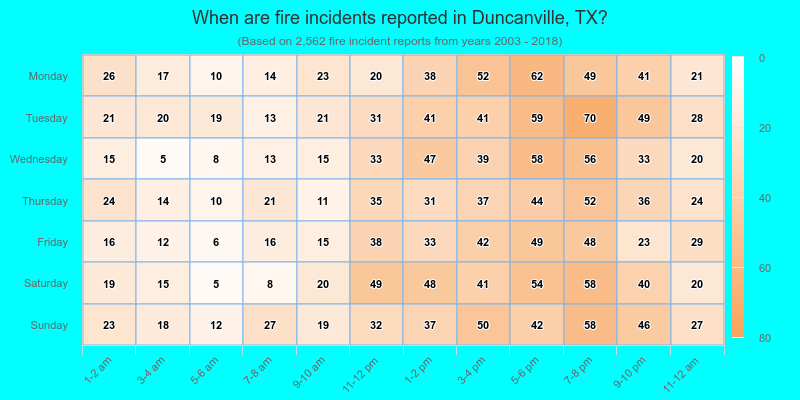
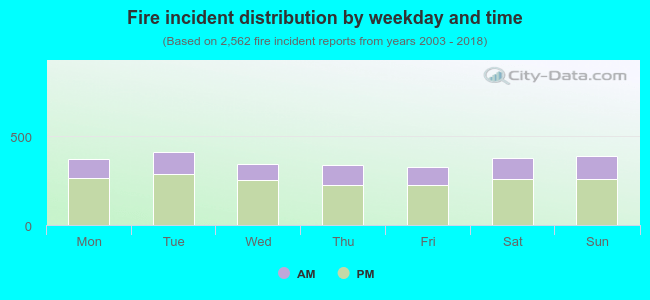 30.8% incidents where reported in the morning and 69.2% in the evening. The most fires (16.1%) took place on Tuesday, and the least (12.8%) on Friday.
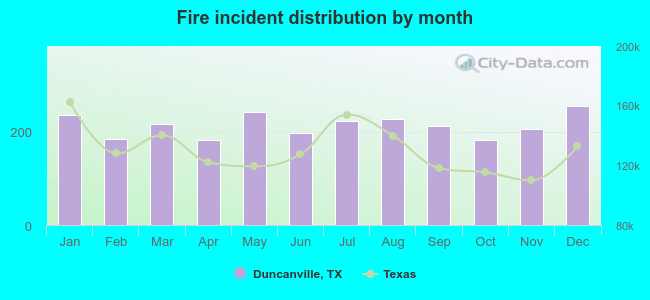 Based on the 2,562 fire incident reports from years 2003 - 2018 most fires (10.0%) took place during December, and the least (7.1%) in October.
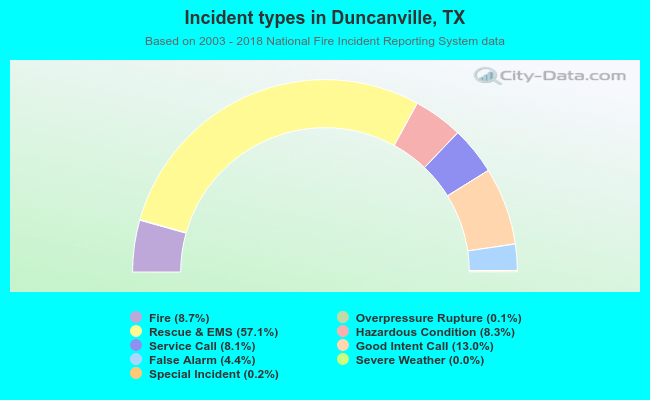 Out of all 29,408 cases reported during the years 2003 - 2018, the most belonged to the categories: Rescue & EMS (57.1%), Good Intent Call (13.0%), and Fire (8.7%).
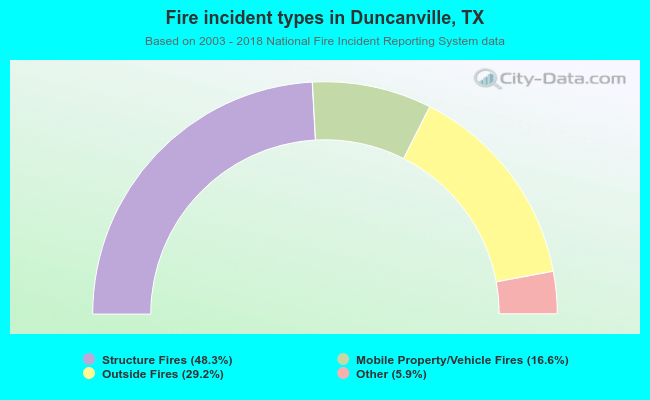 When looking into fire subcategories, the most incidents belonged to: Structure Fires (48.3%), and Outside Fires (29.2%).