Hutchins: Fire Incidents, Texas (TX)
Where are fire incidents reported in Hutchins, TX
Something went wrong! Please refresh the page.
|
| |||||||||||||||||||||||||||||||||||||||||||||||||||||||||||||||||||||||||||||||||||||||||||||||||||||||||||||
2002 - 2018 National Fire Incident Reporting System (NFIRS) incidents
- Incident types reported to NFIRS in Hutchins, TX
- 5,95267.8%Rescue & EMS
- 7748.8%Fire
- 6807.7%Service Call
- 6797.7%Hazardous Condition
- 5085.8%Good Intent Call
- 1681.9%False Alarm
- 200.2%Special Incident
- Fire incident types reported to NFIRS in Hutchins, TX
- 33042.6%Outside Fires
- 23430.2%Mobile Property/Vehicle Fires
- 18323.6%Structure Fires
- 273.5%Other
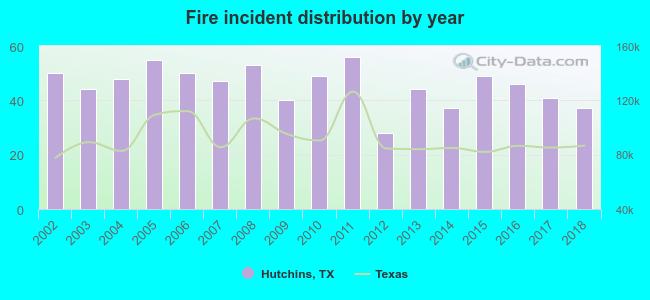 Based on the data from the years 2002 - 2018 the average number of fires per year is 46. The highest number of reported fire incidents - 56 took place in 2011, and the least - 28 in 2012. The data has a decreasing trend.
The average number of yearly fire incidents per 10k residents in Hutchins, TX compared to nearest cities:
(Note: Based on data for the last 3 years, including only cities with population 5,000 and above)
| Hutchins: | 76.1 |
| Lancaster: | 43.2 |
| Balch Springs: | 39.0 |
| Seagoville: | 51.3 |
| DeSoto: | 30.4 |
| Red Oak: | 70.4 |
| Glenn Heights: | 40.3 |
| Mesquite: | 31.4 |
| Dallas: | 16.3 |
 The median response time based on all reported fire incidents is 6 minutes. This is close to the state median value.
The median response time in Hutchins, TX compared to nearest cities:
(Note: Based on data for all years, including only cities with at least 500 fire incidents)
| Hutchins: | 6 minutes |
| Wilmer: | 6 minutes |
| Lancaster: | 6 minutes |
| Balch Springs: | 5 minutes |
| Ferris: | 10 minutes |
| Seagoville: | 5 minutes |
| DeSoto: | 6 minutes |
| Red Oak: | 6 minutes |
| Glenn Heights: | 5 minutes |
 31.4% incidents where reported in the morning and 68.6% in the evening. The most fires (16.7%) took place on Tuesday, and the least (11.5%) on Friday.
 According to the 774 fire incidents from years 2002 - 2018 most fires (10.9%) took place during July, and the least (6.3%) in May.
 Out of all 8,785 cases reported during the years 2002 - 2018, the most belonged to the categories: Rescue & EMS (67.8%), Fire (8.8%), and Service Call (7.7%).
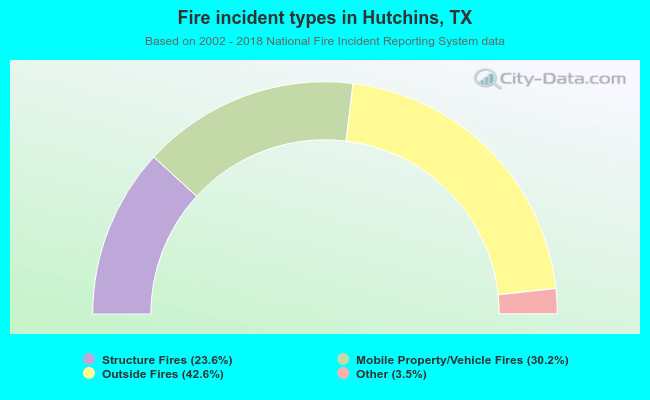 When looking into fire subcategories, the most reports belonged to: Outside Fires (42.6%), and Mobile Property/Vehicle Fires (30.2%).