Dunstable: Fire Incidents, Massachusetts (MA)
Where are fire incidents reported in Dunstable, MA
Something went wrong! Please refresh the page.
|
| |||||||||||||||||||||||||||||||||||||||||||||||||||||||||||||||||||||||||||||||||||||||||
2004 - 2018 National Fire Incident Reporting System (NFIRS) incidents
- Incident types reported to NFIRS in Dunstable, MA
- 62041.6%Rescue & EMS
- 28919.4%Service Call
- 17211.6%Hazardous Condition
- 15910.7%False Alarm
- 1459.7%Fire
- 684.6%Good Intent Call
- 261.7%Severe Weather
- 90.6%Special Incident
- Fire incident types reported to NFIRS in Dunstable, MA
- 6947.6%Outside Fires
- 6142.1%Structure Fires
- 117.6%Mobile Property/Vehicle Fires
- 42.8%Other
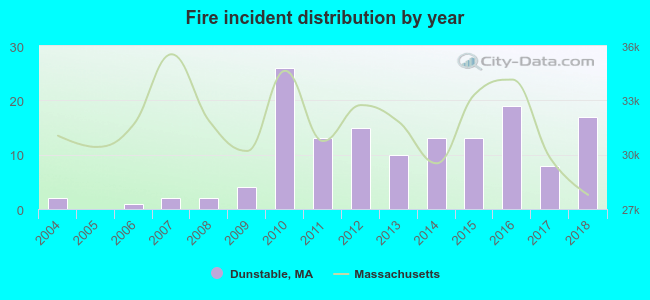 Based on the data from the years 2004 - 2018 the average number of fires per year is 10. The highest number of fire incidents - 26 took place in 2010, and the least - 0 in 2005. The data has an increasing trend.
 30.3% incidents where reported in the morning and 69.7% in the evening. The most fires (24.1%) took place on Saturday, and the least (10.3%) on Monday.
 According to the 145 reports from years 2004 - 2018 most fires (20.0%) took place during April, and the least (4.1%) in September.
 Out of all 1,489 cases reported during the years 2004 - 2018, the most belonged to the categories: Rescue & EMS (41.6%), Service Call (19.4%), and Hazardous Condition (11.6%).
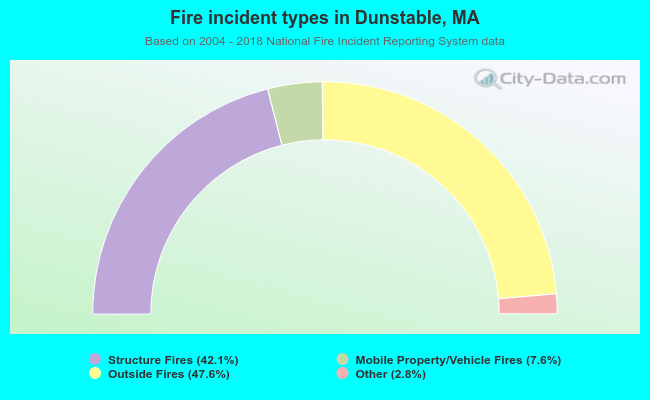 When looking into fire subcategories, the most incidents belonged to: Outside Fires (47.6%), and Structure Fires (42.1%).