Duquesne: Fire Incidents, Pennsylvania (PA)
Where are fire incidents reported in Duquesne, PA
Something went wrong! Please refresh the page.
|
| |||||||||||||||||||||||||||||||||||||||||||||||||||||||||||||||||||||||||||||||||||||||||||||||||||||||||||||
2005 - 2018 National Fire Incident Reporting System (NFIRS) incidents
- Incident types reported to NFIRS in Duquesne, PA
- 33332.3%Fire
- 19719.1%Hazardous Condition
- 19218.6%Good Intent Call
- 12712.3%Service Call
- 888.5%False Alarm
- 858.2%Rescue & EMS
- 50.5%Severe Weather
- 50.5%Special Incident
- Fire incident types reported to NFIRS in Duquesne, PA
- 25977.8%Structure Fires
- 319.3%Outside Fires
- 267.8%Other
- 175.1%Mobile Property/Vehicle Fires
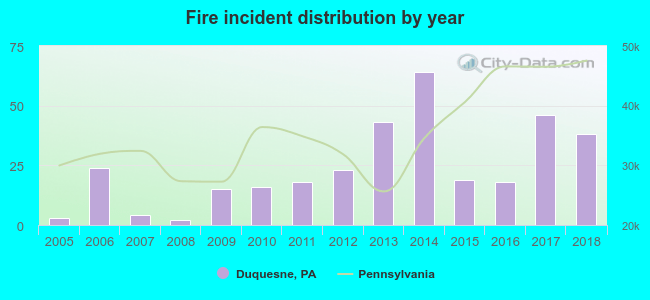 According to the data from the years 2005 - 2018 the average number of fires per year is 24. The highest number of reported fire incidents - 64 took place in 2014, and the least - 2 in 2008. The data has a growing trend.
The average number of yearly fire incidents per 10k residents in Duquesne, PA compared to nearest cities:
(Note: Based on data for the last 3 years, including only cities with population 5,000 and above)
| Duquesne: | 61.6 |
| McKeesport: | 43.3 |
| North Versailles: | 41.8 |
| West Mifflin: | 48.2 |
| White Oak: | 18.3 |
| Munhall: | 46.6 |
| Turtle Creek: | 43.4 |
| Forest Hills: | 31.9 |
| Swissvale: | 58.0 |

 41.1% incidents where reported in the morning and 58.9% in the evening. The most fires (19.2%) took place on Sunday, and the least (12.3%) on Saturday.
 According to the 333 fire incidents from years 2005 - 2018 most fires (14.1%) took place during May, and the least (3.3%) in October.
 Out of all 1,032 cases reported during the years 2005 - 2018, the most belonged to the categories: Fire (32.3%), Rescue & EMS (19.1%), and Service Call (18.6%).
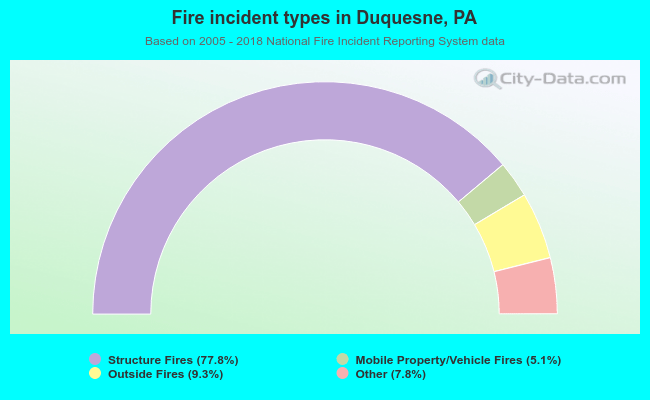 When looking into fire subcategories, the most reports belonged to: Structure Fires (77.8%), and Outside Fires (9.3%).